Measure MTTD and MTTR for Your Application
Learn why Mean Time to Discover (MTTD) and Mean Time to Resolve (MTTR) are critical metrics for any organization's incident management team.
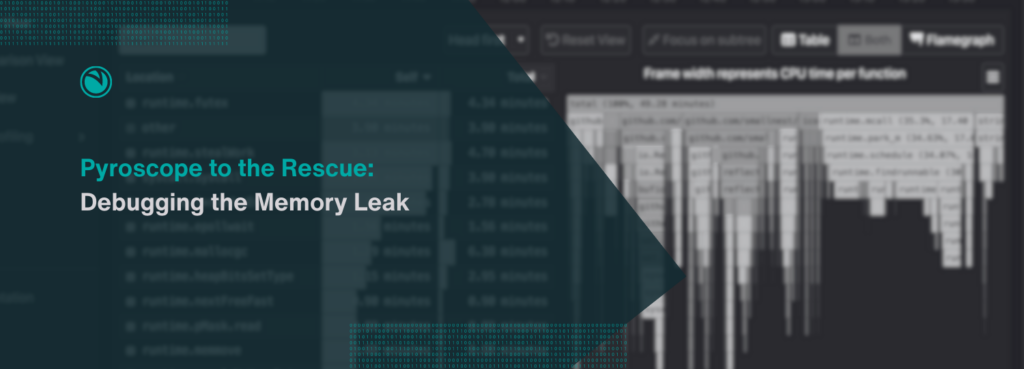
Pyroscope to the Rescue: Debugging a Memory Leak
A pesky memory leak kept bothering our dev team for many months. Using Pyroscope, we were able to pinpoint the issue and fix it immediately.
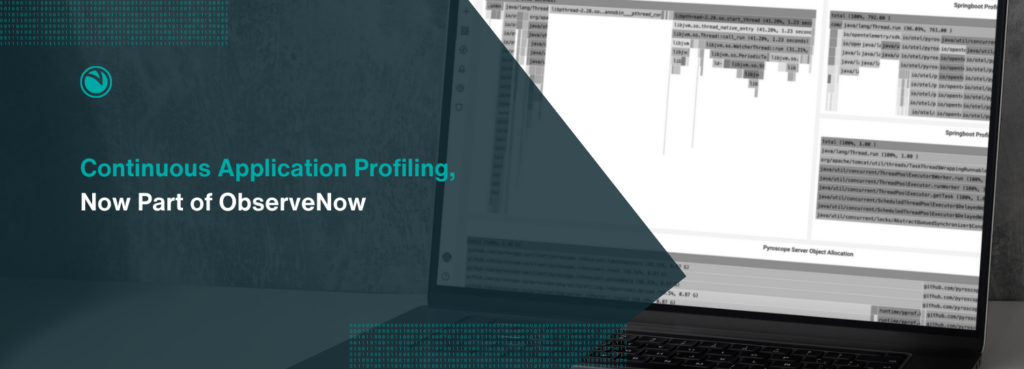
Continuous Application Profiling, now part of ObserveNow
ObserveNow Profiler, now part of OpsVerse ObserveNow allows developers to identify bottlenecks and areas for improvement within live applications. This allows developers to get a more accurate understanding of how their systems are functioning and identify any issues that may not have been apparent in a testing environment.
How do I measure Web performance?
Web performance is all about making websites feel smooth, and the tradeoffs developers can make to get that feeling of slickness. But when we talk about performance and making websites “fast” what metrics are we actually talking about?
K8s auto-instrumentation with OpsVerse + Odigos
As a company built on top of open source observability tools and in collaboration with the thriving OSS community, we’re always on the lookout for new, interesting projects that we can leverage, sponsor, and contribute to. And in recent months, a project that we’ve been tracking closely is Odigos.
Frontend Monitoring with OpsVerse ObserveNow
Frontend monitoring allows you to instrument your frontend applications with just a few lines of code, while also providing the flexibility to build up more complex observability use-cases. And once you instrument your application, all your application logs, metrics, and traces are sent as part of the same instrumentation stack that your backend code is integrated with, allowing you to observe, monitor, alert, and debug your entire service stack, from end-to-end, through a single, configurable view!


