The dreaded conversation
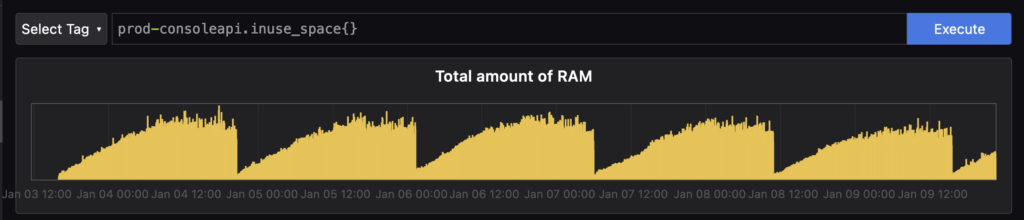
A few months ago, on a beautiful Bengaluru day, while sitting comfortably in our cozy little office, one of our founding engineers, Aravind, came up to me and said those dreaded words: “I’ve been looking at our app metrics and I think we have a memory leak in production“. We went into Grafana and saw this graph which confirmed the suspicion.
Looks like our application was gobbling up memory until it hit the 2GB kubernetes resource limit we had placed on the pod and then got killed. And then the process started all over again. Time after time, multiple times a day. Since it’s kubernetes, the pod restart was not really destructive, but annoying nonetheless so we wanted to get to the bottom of this ASAP.
While Grafana is a great way to identify such issues, it’s not great for debugging since it doesn’t give us the kind of low-level information we need. Since this application is written in Node, the old-school way to debug this would have been to integrate memwatch into our app, and then take manual heapdumps and then crawl through the dump to identify the issues. But we knew we could do better.
Welcoming a modern toolset
Around the same time, the dev-team building out ObserveNow, our turnkey, managed observability (o11y) stack was experimenting with profiling tools to integrate into our stack, and what better way to dogfood our own tools than to leverage them for a production issue? The tool which was the clear frontrunner for our o11y stack was Pyroscope, so we quickly integrated it into our app. (These instructions are now part of our docs)
$ npm install @pyroscope/nodejs

$ tail index.ts

.

.

const Pyroscope = require('@pyroscope/nodejs');

Pyroscope.init({ serverAddress: '<server-address>',

                 authToken: '<api-key>'',

                 appName: '<app-name>'

});

Pyroscope.start()
And that’s it. Our application was now being continuously profiled by Pyroscope! So let’s go to our Application Profiling Dashboard to see what’s up. Sure enough, we could immediately verify what Grafana was telling us in terms of memory consumption.
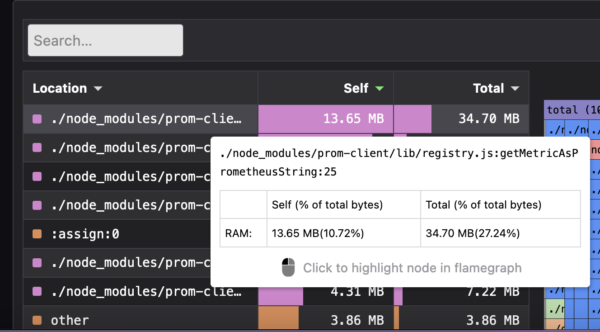
But what Pyroscope shines at is allowing developers to immediately dig in and see what objects are consuming memory/CPU for our application at the low-level. In our case, it looks like it was something to do with prom-client, which (ironically) we use to track our app metrics.
PromClient Pyroscope
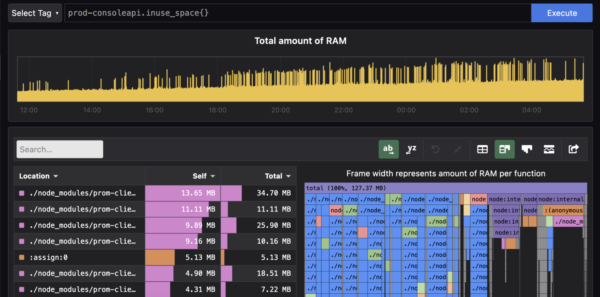
PromClient Pyroscopa
Since we have this information at our fingertips, we can now debug this issue to see why we have so many instances of registry getting created and why the getMetricsAsPrometheusString method is taking up so much memory. Turns out, the reason was that we were creating registry instances every single time metrics were being scraped rather than re-using a singleton registry. And as with many issues like this, it was a few erroneous lines in a PR which had gone through the entire review+testing process but got triggered only when we had the application running for a longer time. The fix was now obvious. We moved the prom-client code into a singleton service and ensured that we re-use the singleton. An hour later, the fix was pushed to production.
The Result
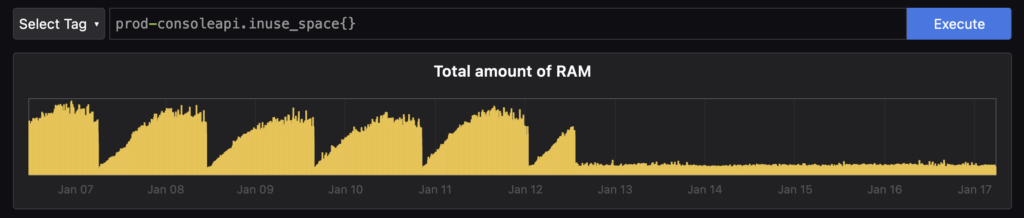
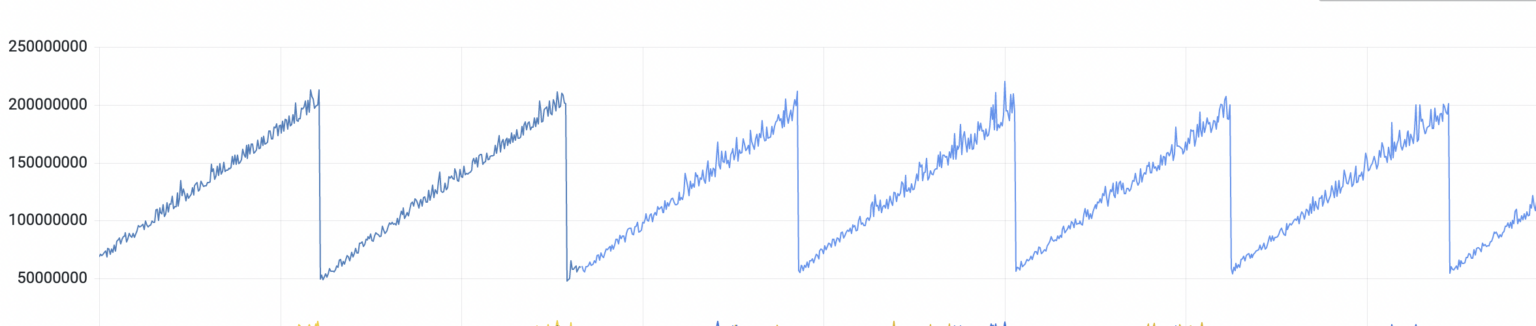
Can you figure out the moment where the fix was pushed to production? And as a developer, is there a more beautiful graph than this?
Thanks to Pyroscope, and the modern paradigm of continuous application profiling, we were able to identify, debug, and fix a memory leak in production, without even breaking a sweat. If you’d like to experience the magic of continuous application profiling for yourself, spin up your own ObserveNow o11y stack and jump into the docs now!
OpsVerse ObserveNow is a managed, battle-tested, scalable observability platform built on top of open source software and open standards. ObserveNow can be deployed as a cloud service or as a private SaaS installation within your own cloud (AWS/GCS/Azure). If you’d like to explore OpsVerse ObserveNow, click here to start a free trial today!