What is Web performance?
Does your web application load quickly, and does it allow the user to start interacting with it without making her wait? Does it offer reassuring feedback if some action takes time to process (e.g., a loading spinner animation)? Are scroll actions and animations smooth on the website? What about latency? Is the application size large? What is the number of resource requests made, javascript performance, and CPU load etc.?
Web performance is all about making websites feel smooth, and the tradeoffs developers can make to get that feeling of slickness. But when we talk about performance and making websites “fast” what metrics are we actually talking about
The fact is, of course, that the definition of “fast” is very relative:
-
A site might be fast for one user on a fast network with a powerful device but slow for another user on a slow network with a low-end device.
-
Two sites may finish loading in the exact same amount of time, yet one may seem to load faster if it loads content progressively rather than waiting until the end to display anything.
-
A site might appear to load faster but then respond slowly (or not at all) to user interaction.
Therefore, when we talk about performance, it is important to be specific and to validate performance in terms of objective metrics that can be measured quantitatively.
Important metrics
First Contentful Paint (FCP): Measures the time from when the page starts loading to when any part of the page content is rendered on the screen.
Largest Contentful Paint (LCP): Measures the time from when the page starts loading to when the largest text block or image element is rendered on the screen.
First Input Delay (FID): Measures the time from when a user first interacts with your site (i.e. when they click a link, tap a button, or use a custom, JavaScript-powered control) to the time when the browser is actually able to respond to that interaction.
Interaction to Next Paint (INP): Measures the latency of every tap, click, or keyboard interaction made with the page, and—based on the number of interactions—selects the worst interaction latency of the page (or close to the highest) as a single, representative value to describe a page’s overall responsiveness.
Time to Interactive (TTI): Measures the time from when the page starts loading to when the page visually rendered with its initial scripts (if any) have loaded, and is capable of reliably responding to user input.
Total Blocking Time (TBT): Measures the total amount of time between FCP and TTI where the main thread was blocked for long enough to prevent input responsiveness.
Cumulative Layout Shift (CLS): Measures the cumulative score of all unexpected layout shifts that occur between when the page starts loading and when its lifecycle state changes to hidden.
Time to First Byte (TTFB): Measures the time it takes for the network to respond to a user request with the first byte of a resource.
Got it, So what’s next ? How do I track these metrics?
Well, OpenTelemetry is what you need. Formed through a merger of the OpenTracing and OpenCensus projects, OpenTelemetry is a CNCF incubating project which offers a collection of tools, APIs, and SDKs that can be used to instrument applications, generate metrics, collate data, and export telemetry. It is an open source project and is a unified standard for service instrumentation, or a way of measuring your software performance and behaviour.
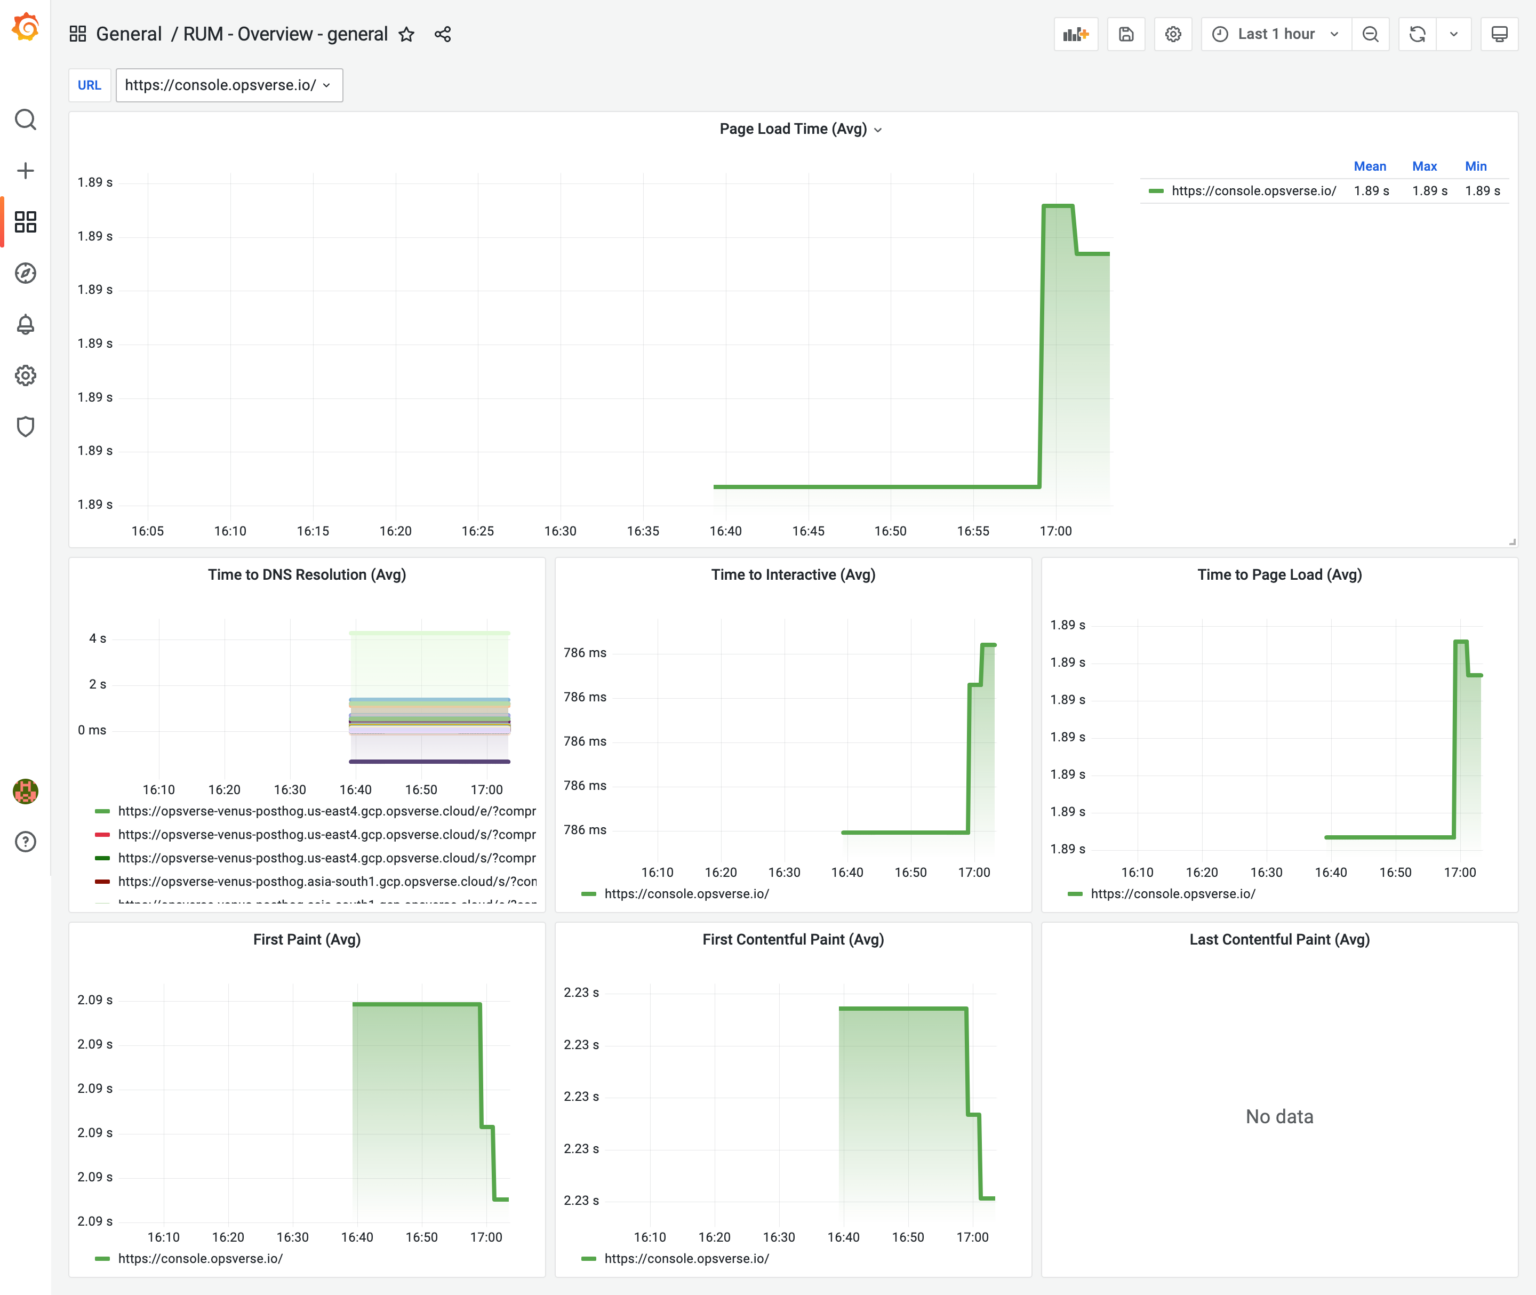
To validate this open source package, we at OpsVerse developed an NPM package named opsverse-rum using the Open Telemetry standard to allow developers to instrument their applications in just a few lines of code and integrate applications into the OpsVerse ObserveNow. Below screenshot is an example of browser metrics displayed on Grafana dashboard, which come pre-configured with every ObserveNow stack.
Since it’s all built on an open standards, you can also choose to use alternative RUM frameworks like Grafana Faro to bring in telemetry into an ObserveNow o11y stack.
Using these simple integrations to measure the metrics that matter, developers can super-charge their workflows to ensure that their web applications always remain performant, and in turn keep their users happy!
OpsVerse ObserveNow is a managed, battle-tested, scalable observability platform built on top of open source software and open standards. ObserveNow can be deployed as a cloud service or as a private SaaS installation within your own cloud (AWS/GCS/Azure). If you’d like to explore OpsVerse ObserveNow, click here to start a free trial today!