What is Continuous Application Profiling?
Continuous application profiling is an amazing technique that lets developers identify bottlenecks and areas for improvement within live applications by constantly tracking what classes/methods within your application are consuming memory, CPU cycles and other such metrics. It can be particularly useful for debugging issues that only occur in production environments. By collecting data on the performance of a program in a real-world setting, developers can get a more accurate understanding of how it is functioning and identify any issues that may not have been apparent in a testing environment.
Across engineering + ops teams we’ve interacted with, we’ve heard multiple anecdotes of teams debugging applications that have been running slow in prod for weeks despite running fine in test environments, discovering a method that’s causing CPU throttling under heavy loads, and rewriting a bunch of code to reduce the application CPU usage by 50% to improve overall efficiency.
But a major point of friction for adoption of profiling has been the high time-cost of setting up and configuring a profiling server, capturing profiling info from individual applications, and finally, taking all this data and turning it into usable information. Continuous application profiling takes this workflow and straps on a jet-engine to it. And the spirit of being the single source of truth for all observability needs, we’re glad to announce ObserveNow Profiler as the latest, standard component of the OpsVerse ObserveNow stack. No more waiting for someone to provide heap dumps from production. No more redeploying apps with esoteric config flags. Just instrument your apps once and that’s it!
Peek under the hood
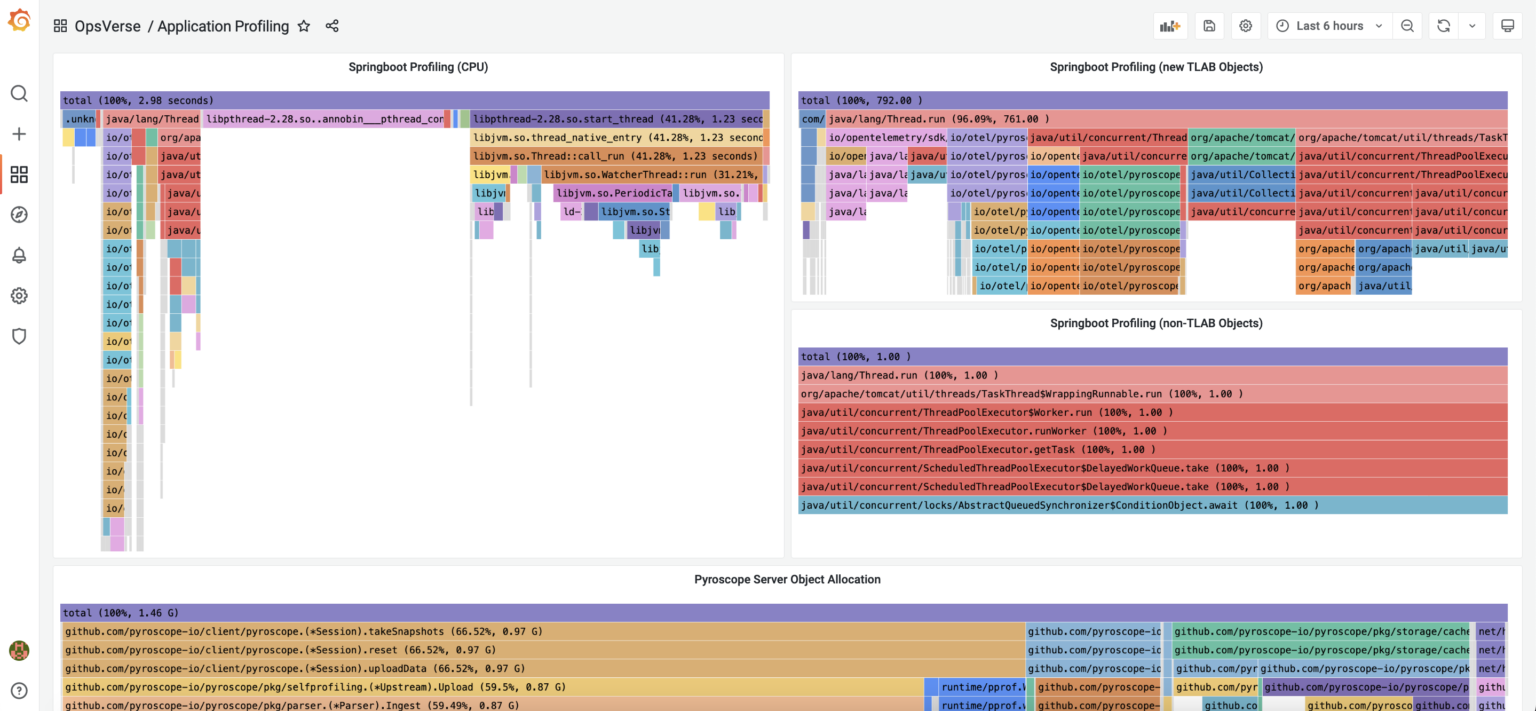
ObserveNow Profiler is powered by Pyroscope, which is one of the most feature-rich, battle-tested open source profilers we’ve used. And with our pre-configured Application Profiling Dashboard, you will be able to use the same Grafana UI that you use for analyzing logs, traces, and metrics to also explore flame-graphs and other profiling information for your apps. From kernel-level metrics powered by eBPF, to applications written in Java, Node, Python, Ruby, Go, or Rust, you’ll be able to instrument your apps with just a few lines of code, and start seeing rich profiling information for your applications.
Sounds interesting? Head over to OpsVerse docs, and experience the power of continuous application profiling for yourself!
OpsVerse ObserveNow is a managed, battle-tested, scalable observability platform built on top of open source software and open standards. ObserveNow can be deployed as a cloud service or as a private SaaS installation within your own cloud (AWS/GCS/Azure). If you’d like to explore OpsVerse ObserveNow, click here to start a free trial today!