NoOps and the Future of DevOps: How GenAI is Eliminating the Tools Tax
This blog explores how generative AI can eliminate "operational toil" and free up developers to focus on innovation.
The Rise of DevOps Copilots: A New Era of Automation and Intelligence
As the demands of modern software development continue to grow, so too does the complexity of DevOps. To keep pace,...
Agentic AI in DevOps: Why Aiden Beats ChatGPT for DevOps Cost Analysis
Here are the 5 critical considerations for selecting a copilot that delivers accurate, secure, and cost-effective automation.
Top 5 Things to Keep in Mind When Choosing an Agentic AI Based DevOps Copilot
Here are the 5 critical considerations for selecting a copilot that delivers accurate, secure, and cost-effective automation.
Jaeger vs. Grafana Tempo: A Comprehensive Comparison for Distributed Tracing
When it comes to monitoring, diagnosing, and optimizing the performance of complex systems today, you can’t really...
Grafana Loki vs. ELK Stack for Logging: A Comprehensive Comparison
With the increasing complexity of modern applications, log management solutions have become synonymous with...
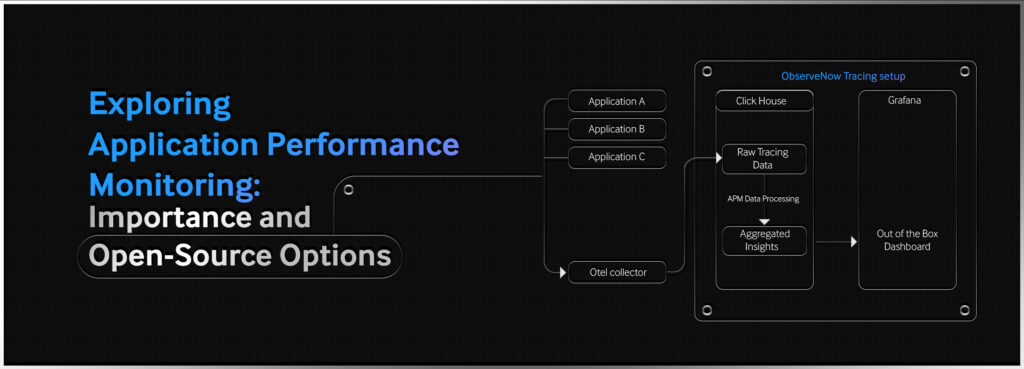
Exploring Application Performance Monitoring – Importance and Open-Source Options
For any digital business today, keeping applications running smoothly and efficiently is a no-brainer. Application...
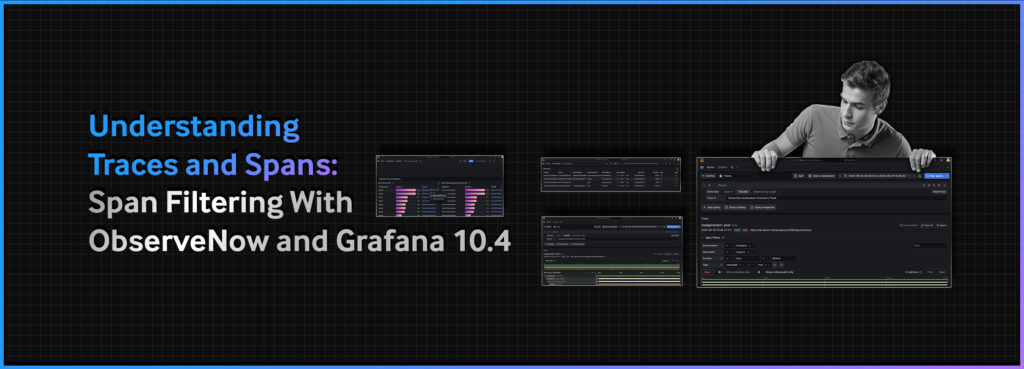
Understanding Traces and Spans: Span Filtering With ObserveNow and Grafana 10.4
ObserveNow, the leading open source-based observability stack, has recently enhanced its capabilities with the...


