When it comes to monitoring, diagnosing, and optimizing the performance of complex systems today, you can’t really go wrong with tracing tools. And while OpenTelemetry has become...
What Is a DevOps Platform?
The concept of DevOps has long gained prominence as a methodology for bridging the gap between development and operations teams. A critical factor in DevOps success, a DevOps...
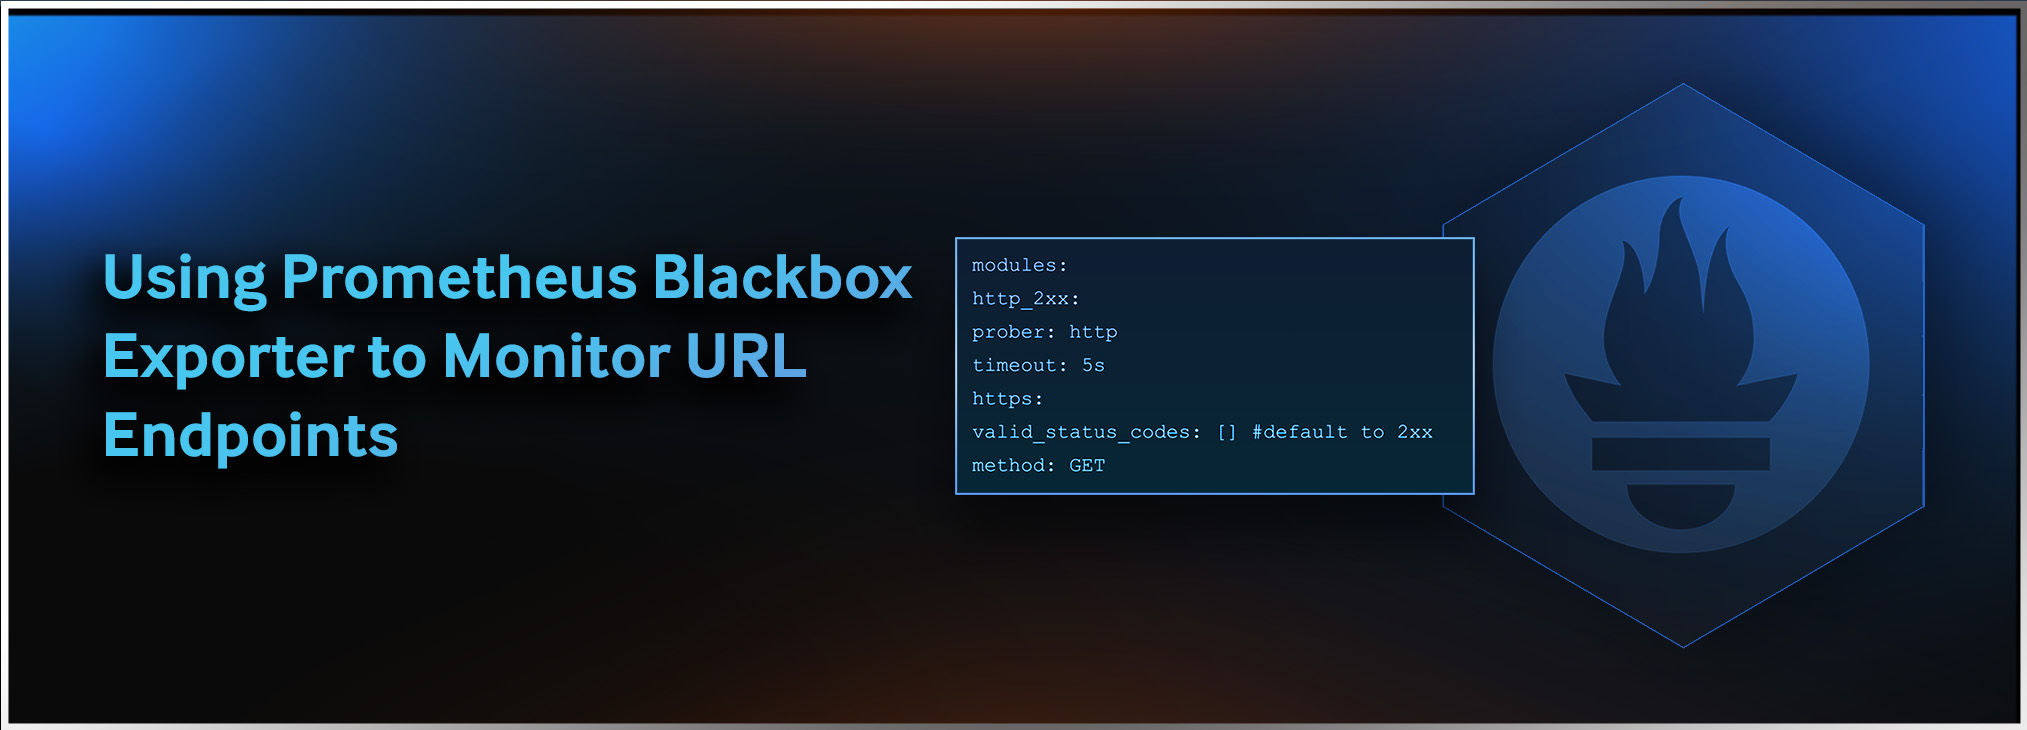
Using Prometheus Blackbox Exporter to Monitor URL Endpoints
One of the basic, but essential steps in monitoring your system is to treat it as a blackbox and to monitor the URL front door to your system. This strategy can also be used to...
Measure MTTD and MTTR for Your Application
What Are MTTD and MTTR? MTTD (Mean Time To Detect) and MTTR (Mean Time To Resolve) are two important metrics used to measure the performance of an organization's incident...
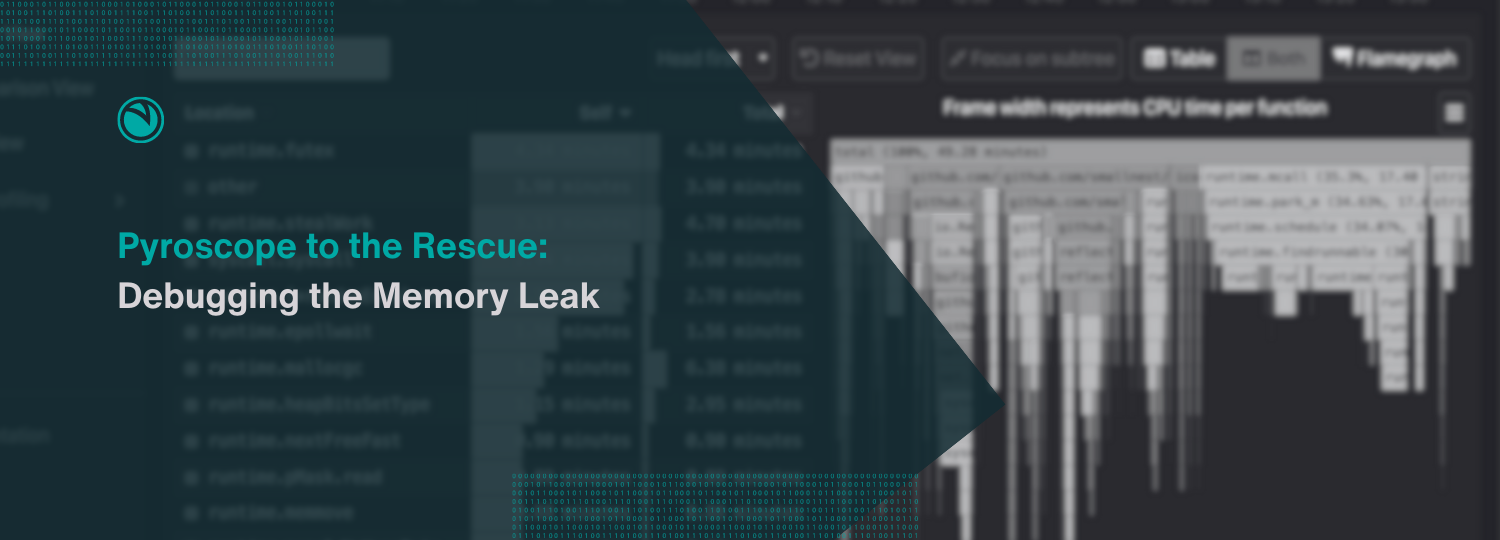
Pyroscope to the Rescue: Debugging a Memory Leak
The dreaded conversation A few months ago, on a beautiful Bengaluru day, while sitting comfortably in our cozy little office, one of our founding engineers, Aravind, came up to...
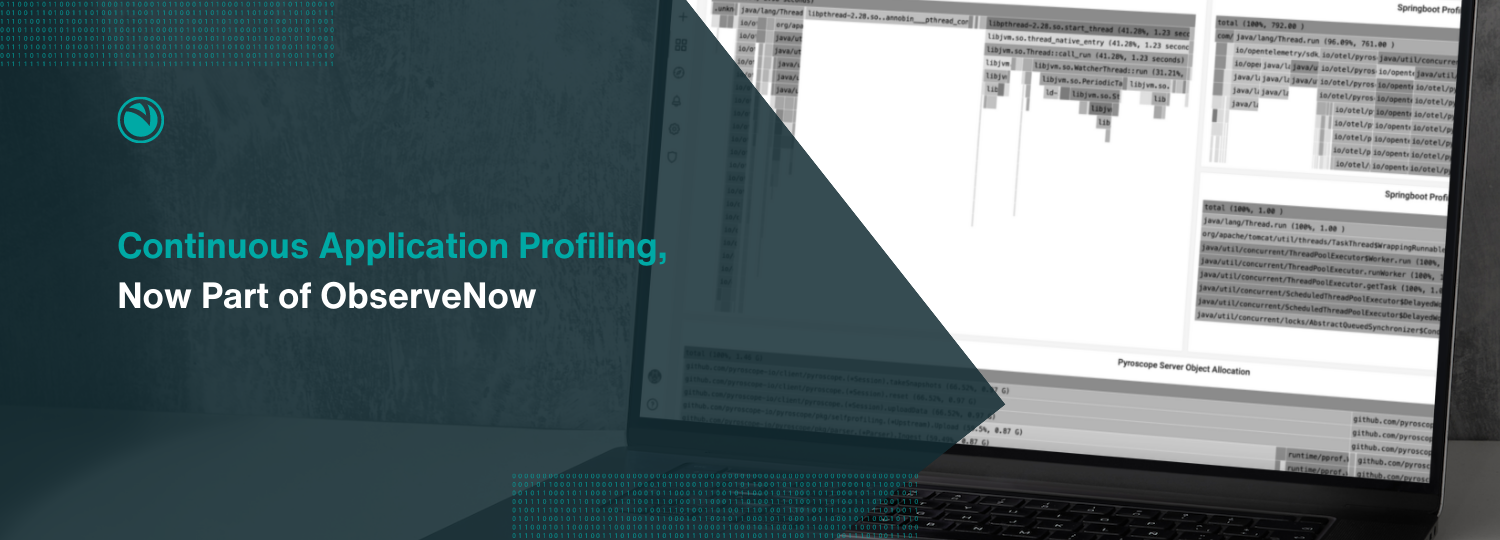
Continuous Application Profiling, now part of ObserveNow
What is Continuous Application Profiling? Continuous application profiling is an amazing technique that lets developers identify bottlenecks and areas for improvement within live...
How do I measure Web performance?
What is Web performance? Does your web application load quickly, and does it allow the user to start interacting with it without making her wait? Does it offer reassuring...
K8s auto-instrumentation with OpsVerse + Odigos
As a company built on top of open source observability tools and in collaboration with the thriving OSS community, we’re always on the lookout for new, interesting projects that...
Frontend Monitoring with OpsVerse ObserveNow
Observability tries to answer the question “How is my system functioning right now?”. And while there are quite a few tools and services that help answer that question for...
OpsVerse Chronicles – What I learned by breaking our staging Kubernetes cluster!
OpsVerse Chronicles: Making of Katafraktos A series which follows detailed, thematic, recounts of a beginner’s real-time firefighting incidents with Kubernetes (and cloud...


