One of the basic, but essential steps in monitoring your system is to treat it as a blackbox and to monitor the URL front door to your system. This strategy can also be used to measure the uptime of your system.
There are several popular open source observability tools out there which can be used to achieve this. In this blog, we will look at using Prometheus and Grafana as the underlying tools to accomplish this. We will discuss two approaches:
- Using docker-compose
- Using OpsVerse’s ObserveNow stack
Using docker-compose
Installing Prometheus and Grafana
The quickest way to run Prometheus and Grafana for testing purposes is to use docker-compose. The repo https://github.com/docker/awesome-compose/tree/master/prometheus-grafana has a good sample docker-compose setup that can be used for this purpose.
git clone https://github.com/docker/awesome-compose.git

cd awesome-compose/prometheus-grafana/

sudo docker-compose up -d
Check if everything is up and running:
$ sudo docker ps

CONTAINER ID   IMAGE             COMMAND                  CREATED          STATUS          PORTS                                       NAMES

b6f474fb7ee5   prom/prometheus   "/bin/prometheus --c…"   27 minutes ago   Up 27 minutes   0.0.0.0:9090->9090/tcp, :::9090->9090/tcp   prometheus

f1e2b600827e   grafana/grafana   "/run.sh"                27 minutes ago   Up 27 minutes   0.0.0.0:3000->3000/tcp, :::3000->3000/tcp   grafana
The newly installed Grafana can be accessed at https://:3000. The default login credentials are admin/grafana.
Configure the blackbox exporter
Add a new file blackbox.yml with the following:
modules:

  http_2xx:

    prober: http

    timeout: 5s

    https:

      valid_status_codes: [] #default to 2xx

      method: GET
Edit the compose.yaml file and add the following:
blackbox_exporter:

  image: prom/blackbox-exporter

  ports:

    - "9115:9115"

  dns: 8.8.8.8

  restart: always

  ports:

    - "9115:9115"

  volumes:

    - "./:/config"

 command: '--config.file=/config/blackbox.yml'
Setup the scrape config by adding the following to the end of the prometheus/prometheus.yml file:
Restart docker-compose:
	sudo docker-compose down

	sudo docker-compose up -d
This should start the following containers:
- job_name: 'blackbox'

  metrics_path: /probe

  params:

    module: [http_2xx]

  static_configs:

    - targets:

        - https://wronghost.com

        - https://opsverse.io

  relabel_configs:

    - source_labels: [__address__]

      regex: (.*)(:80)?

      target_label: __param_target

    - source_labels: [__param_target]

      regex: (.*)

      target_label: instance

      replacement: ${1}

    - source_labels: []

      regex: .*

      target_label: __address__

      replacement: blackbox_exporter:9115
$ sudo docker ps

CONTAINER ID   IMAGE                    COMMAND                  CREATED         STATUS         PORTS                                       NAMES

b2b0ec5be8da   grafana/grafana          "/run.sh"                4 minutes ago   Up 4 minutes   0.0.0.0:3000->3000/tcp, :::3000->3000/tcp   grafana

d78945307409   prom/prometheus          "/bin/prometheus --c…"   4 minutes ago   Up 4 minutes   0.0.0.0:9090->9090/tcp, :::9090->9090/tcp   prometheus

8fa5098fc164   prom/blackbox-exporter   "/bin/blackbox_expor…"   4 minutes ago   Up 4 minutes   0.0.0.0:9115->9115/tcp, :::9115->9115/tcp   prometheus-grafana_blackbox_exporter_1
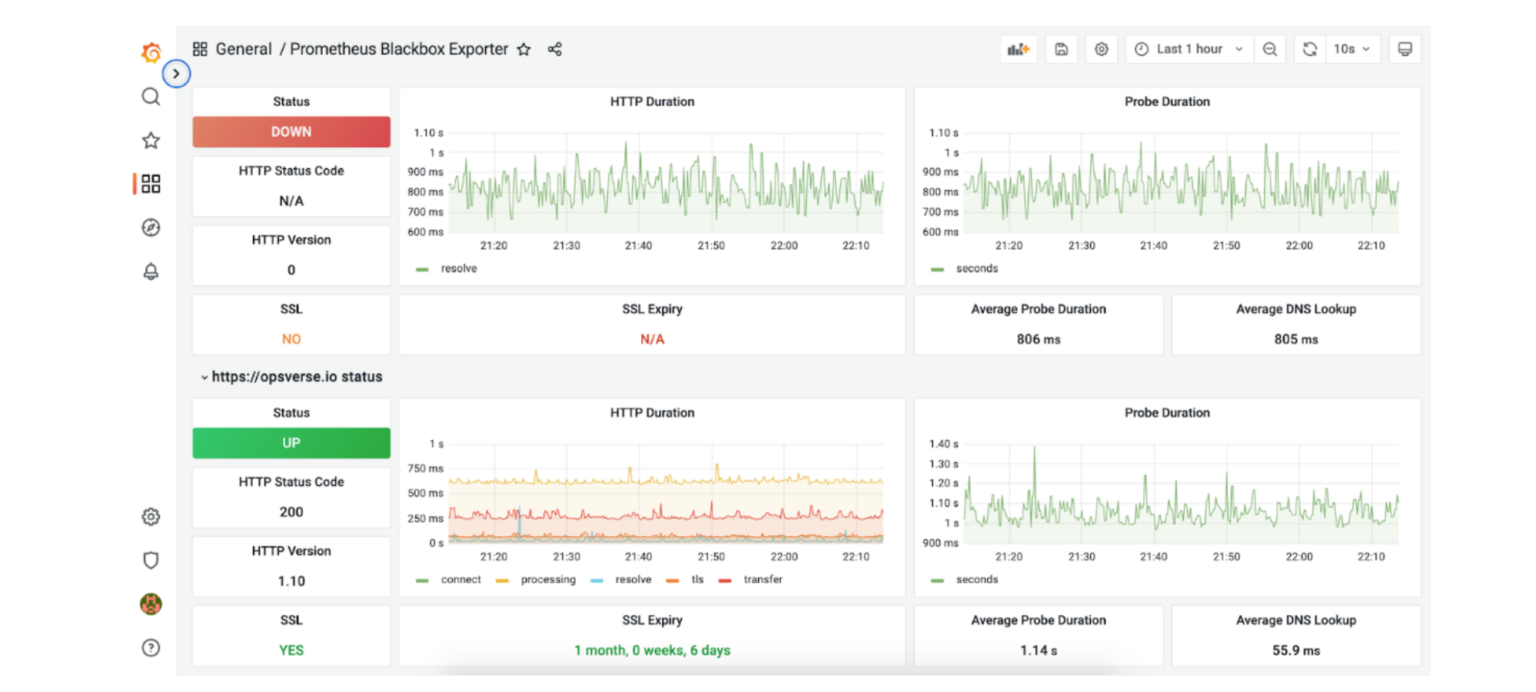
Visualize the collected metrics
Import the Grafana dashboard https://grafana.com/grafana/dashboards/7587-prometheus-blackbox-exporter/ to visualize the collected metrics:
Using OpsVerse’s ObserveNow Stack
OpsVerse’s ObserveNow is a full stack observability solution based on OSS tools that brings together metrics, logs and distributed traces under one platform. It makes the above steps much easier.
Launch the stack
Launch an instance of OpsVerse’s ObserveNow through the OpsVerse admin console. More info here: https://www.youtube.com/watch?v=WEfpPZt_x3s
Enable The Blackbox exporter agent
Prerequisites: The OpsVerse agent is installed in the cluster and the corresponding values.yaml is available on your machine. Add the following to the values.yaml:
blackbox-exporter:

  enabled: true
Rerun the following command to update the agent’s installation with the blackbox configuration:
helm upgrade --install devopsnow-agent -n devopsnow --create-namespace

observe-agent --repo https://registry.devopsnow.io/chartrepo/public -f values.yaml
Refer to the official blackbox chart on prometheus github to check the values that can be overridden as part of the helm chart that is pre-installed on the OpsVerse-agent
https://github.com/prometheus-community/helm-charts/blob/main/charts/prometheus-blackbox-exporter/values.yaml
https://github.com/prometheus/blackbox_exporter/blob/master/example.yml
After enabling the exporter, add a custom scrape job as part of the victoria-metrics-agent field, defined in the same values file, similar to the following:
- job_name: 'blackbox-grafana-venus'

          scrape_timeout: 30s

          scrape_interval: 30s

          metrics_path: /probe

          params:

           module: [http_2xx]

          static_configs:

            - targets:

              - https://wronghost.com

              - https://opsverse.io

          relabel_configs:

            - source_labels: [__address__]

              target_label: __param_target

            - source_labels: [__param_target]

              target_label: instance

            - target_label: __address__

              replacement: devopsnow-agent-blackbox-exporter.devopsnow:9115
Notice how the scrape job contains the urls of the targets that need to be monitored.
It is important to configure the relabel_configs, especially the __address__ target label, which helps the prometheus agent to identify and scrape the blackbox service for metrics.
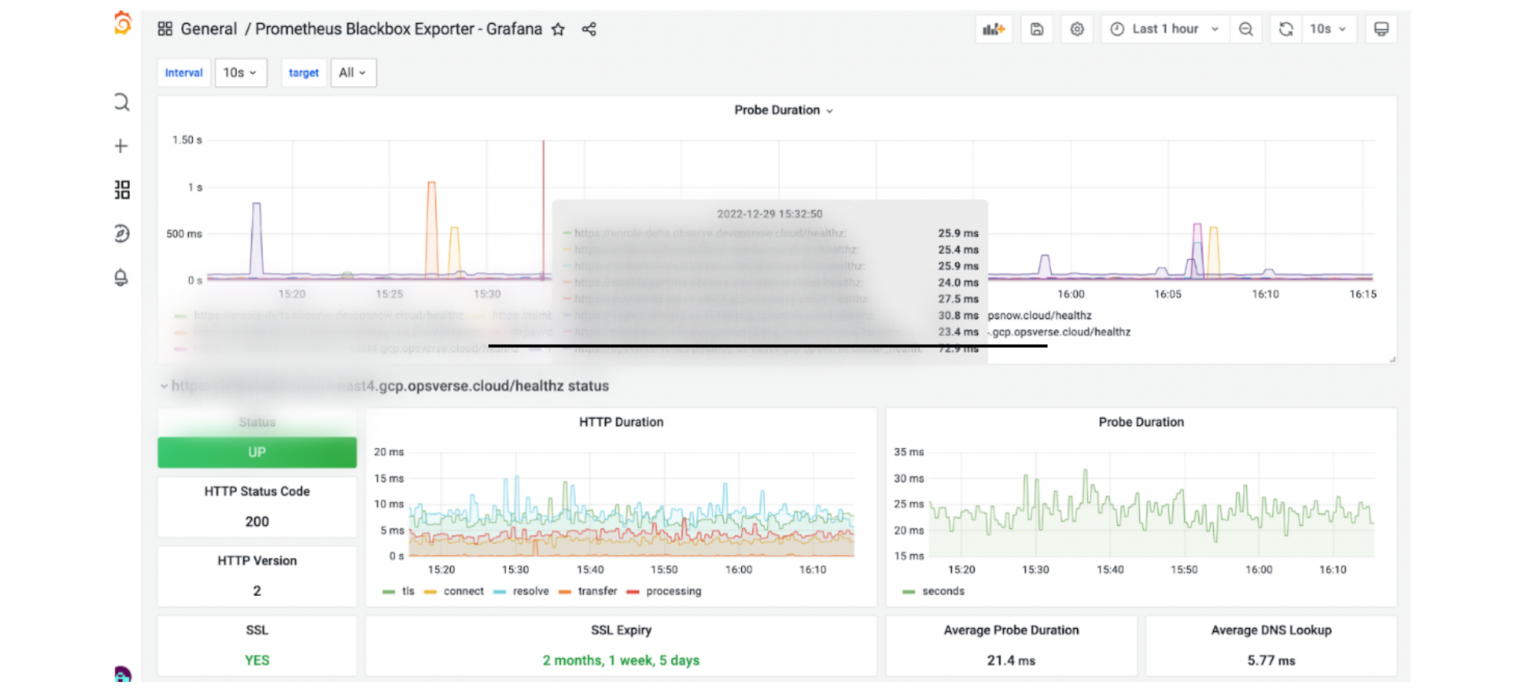
Visualize the collected metrics
OpsVerse’s ObserveNow stack already has prepackaged dashboards which should now display telemetry collected from the agent.
OpsVerse ObserveNow is a managed, battle-tested, scalable observability platform built on top of open source software and open standards. ObserveNow can be deployed as a cloud service or as a private SaaS installation within your own cloud (AWS/GCS/Azure). If you’d like to explore OpsVerse ObserveNow, click here to start a free trial today!