When it comes to monitoring, diagnosing, and optimizing the performance of complex systems today, you can’t really go wrong with tracing tools. And while OpenTelemetry has become...

When it comes to monitoring, diagnosing, and optimizing the performance of complex systems today, you can’t really go wrong with tracing tools. And while OpenTelemetry has become...
With the increasing complexity of modern applications, log management solutions have become synonymous with troubleshooting, monitoring, and ensuring application reliability....
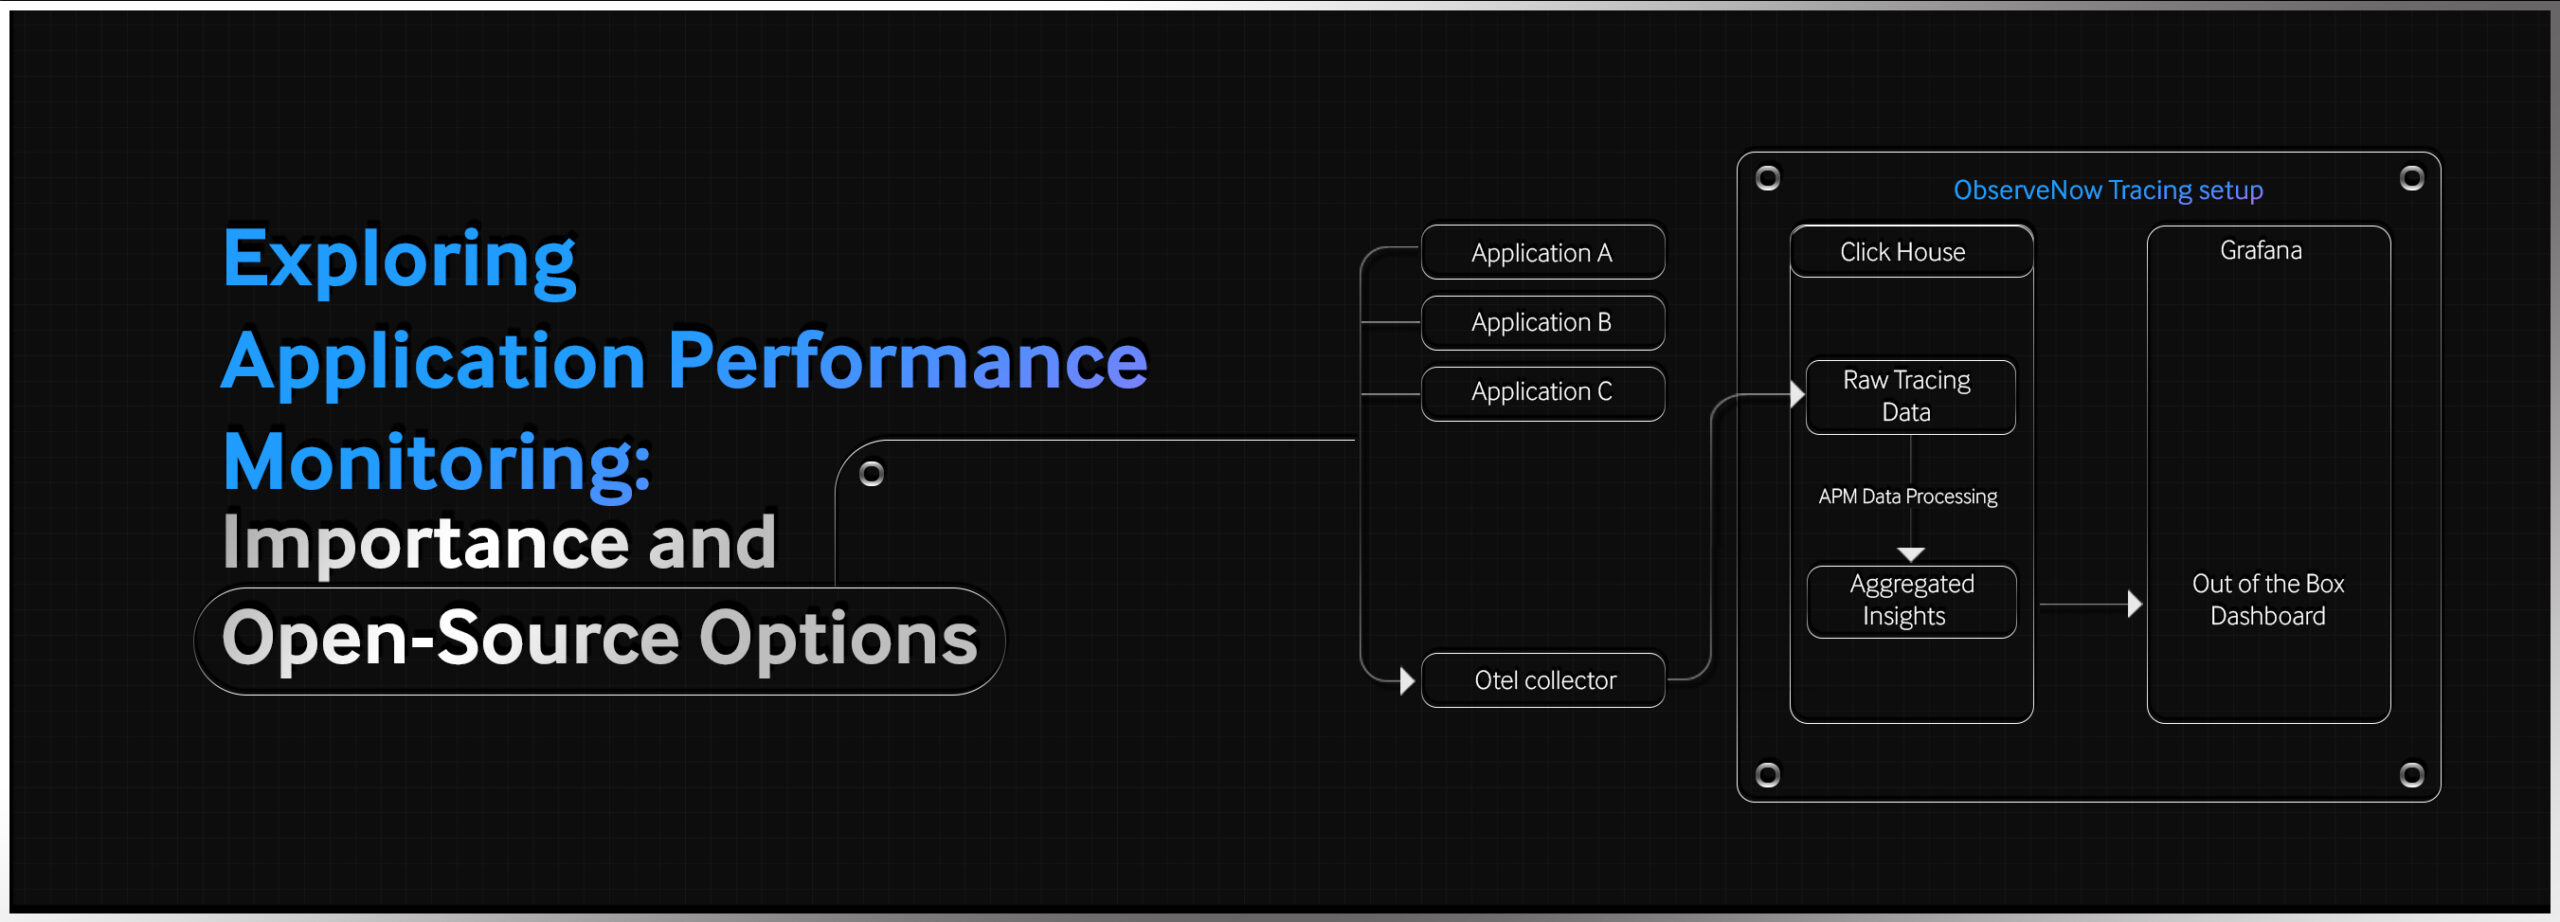
For any digital business today, keeping applications running smoothly and efficiently is a no-brainer. Application Performance Monitoring (APM) is an invaluable process in that...
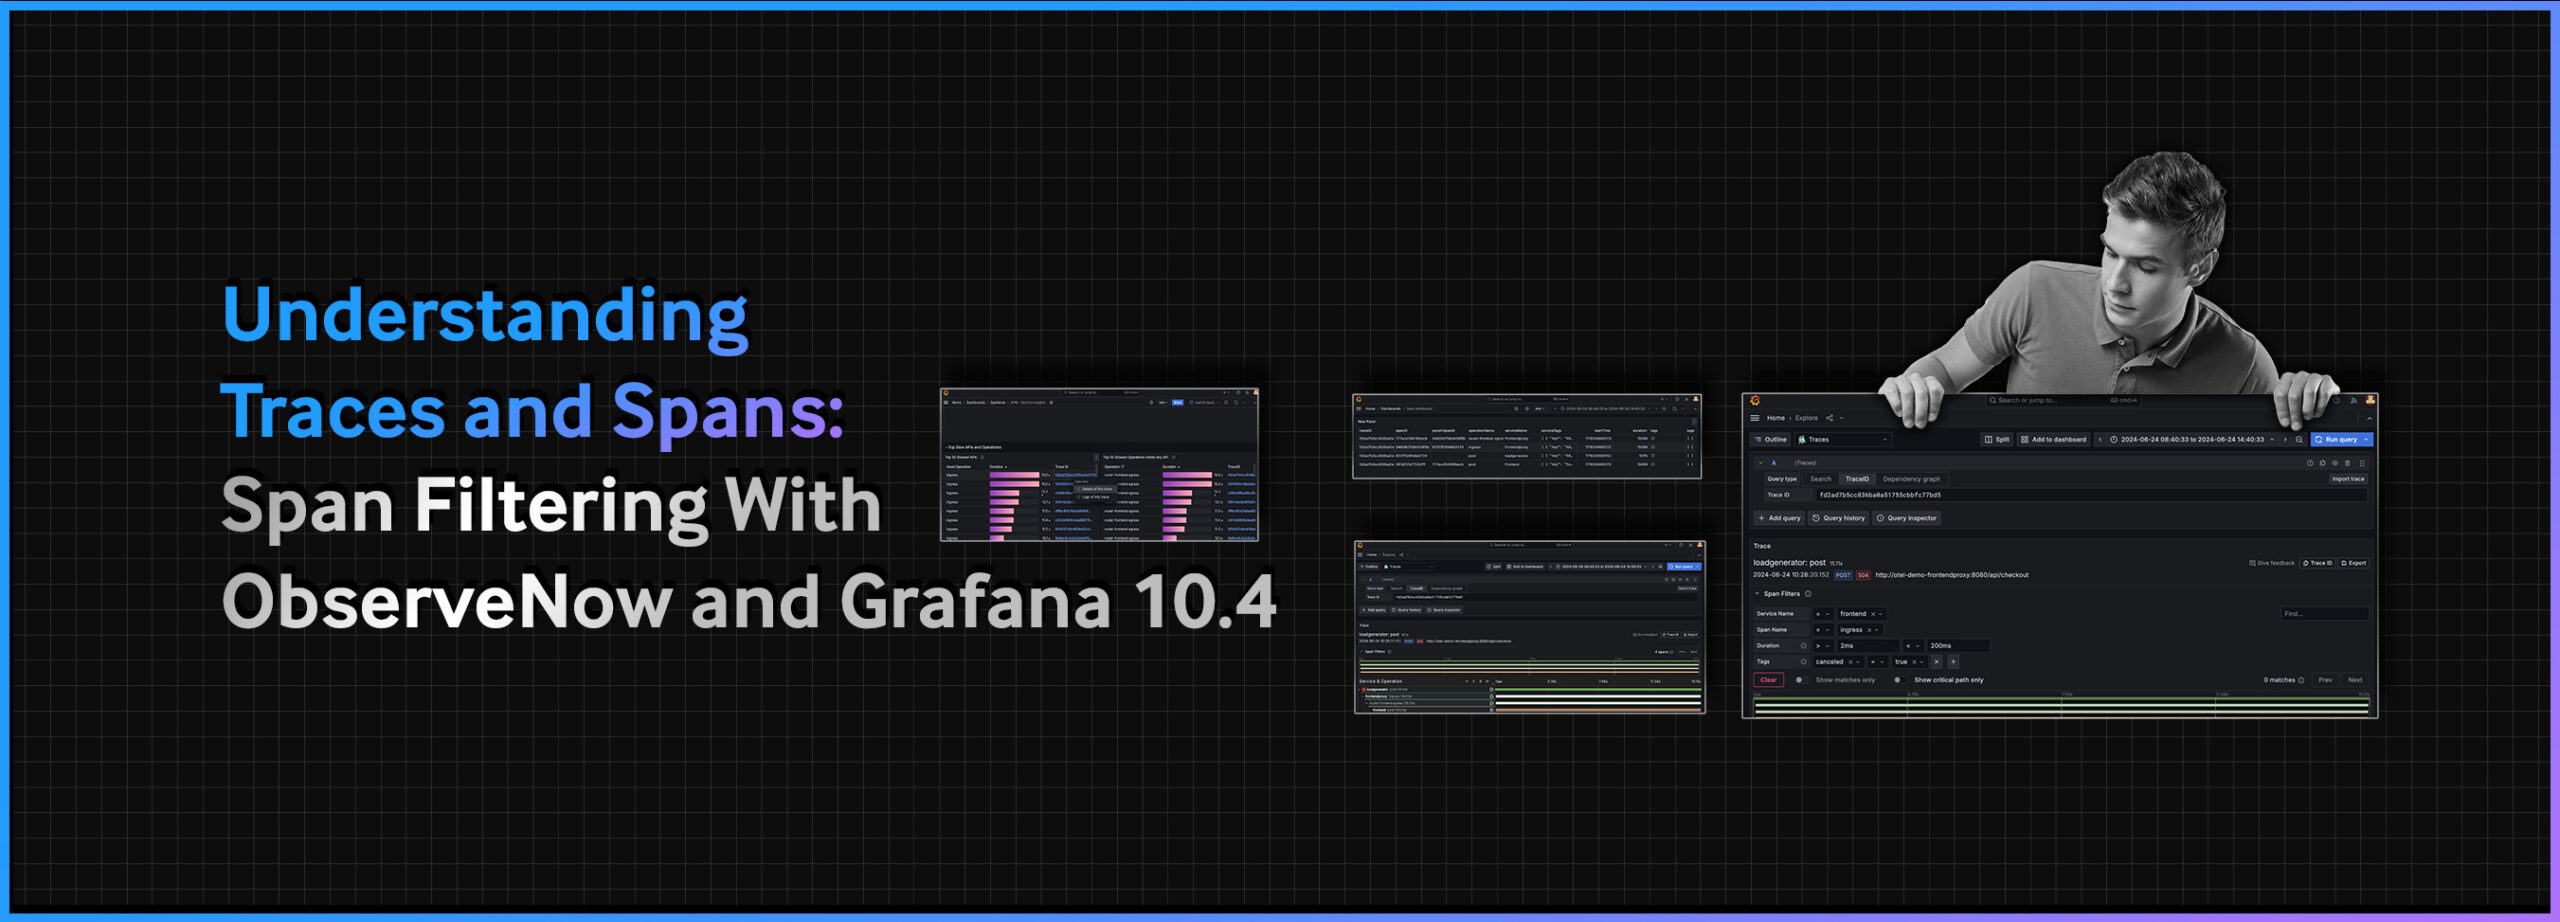
ObserveNow, the leading open source-based observability stack, has recently enhanced its capabilities with the introduction of Span Filtering – a key feature in its latest...
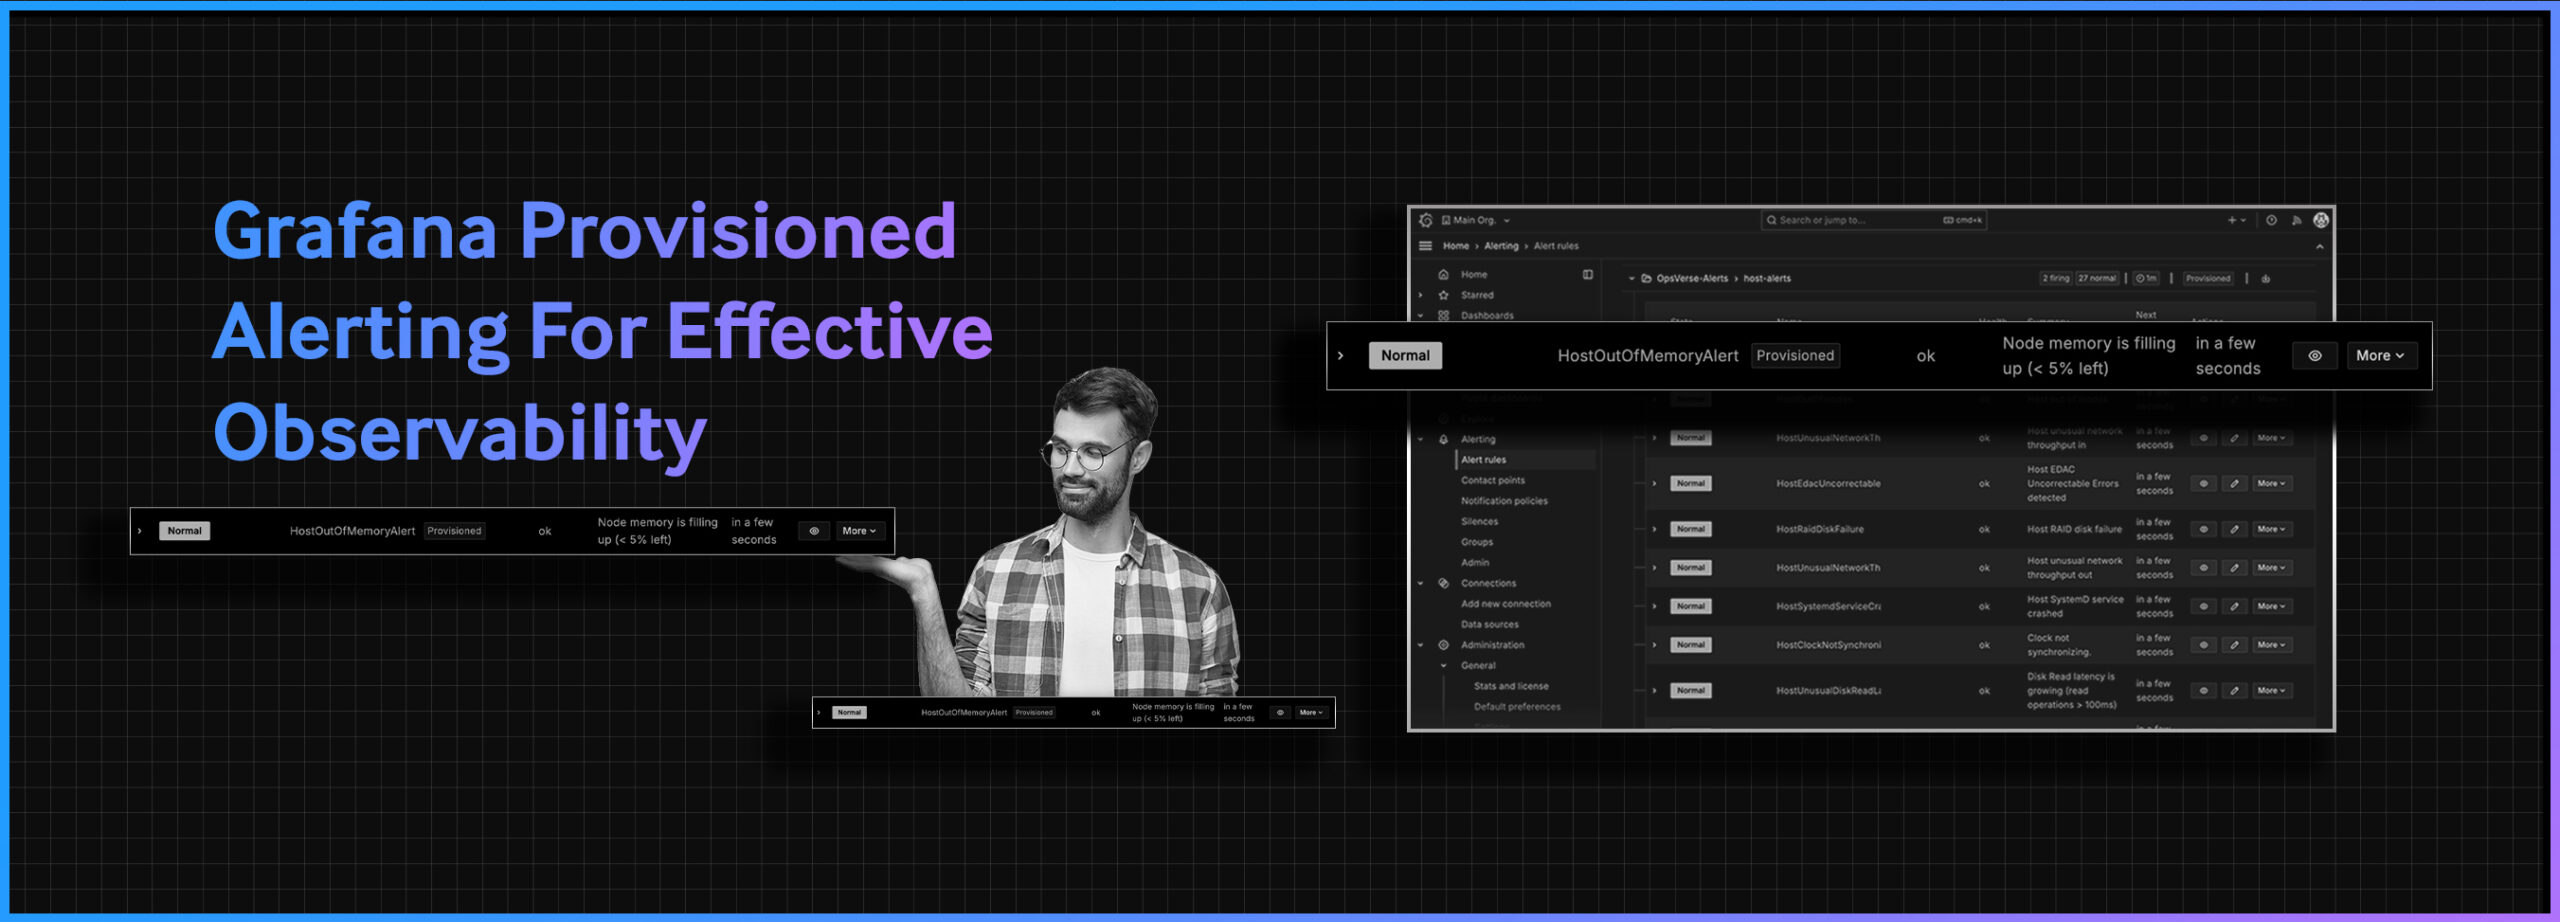
Implementing a consistent and reliable alerting system across a sprawling organization is a significant challenge for just about any engineering team. For example, diverse...
Many of our customers frequently ask us how they can calculate the ROI of their observability platforms. It’s a tough question, and one that comes up because company...
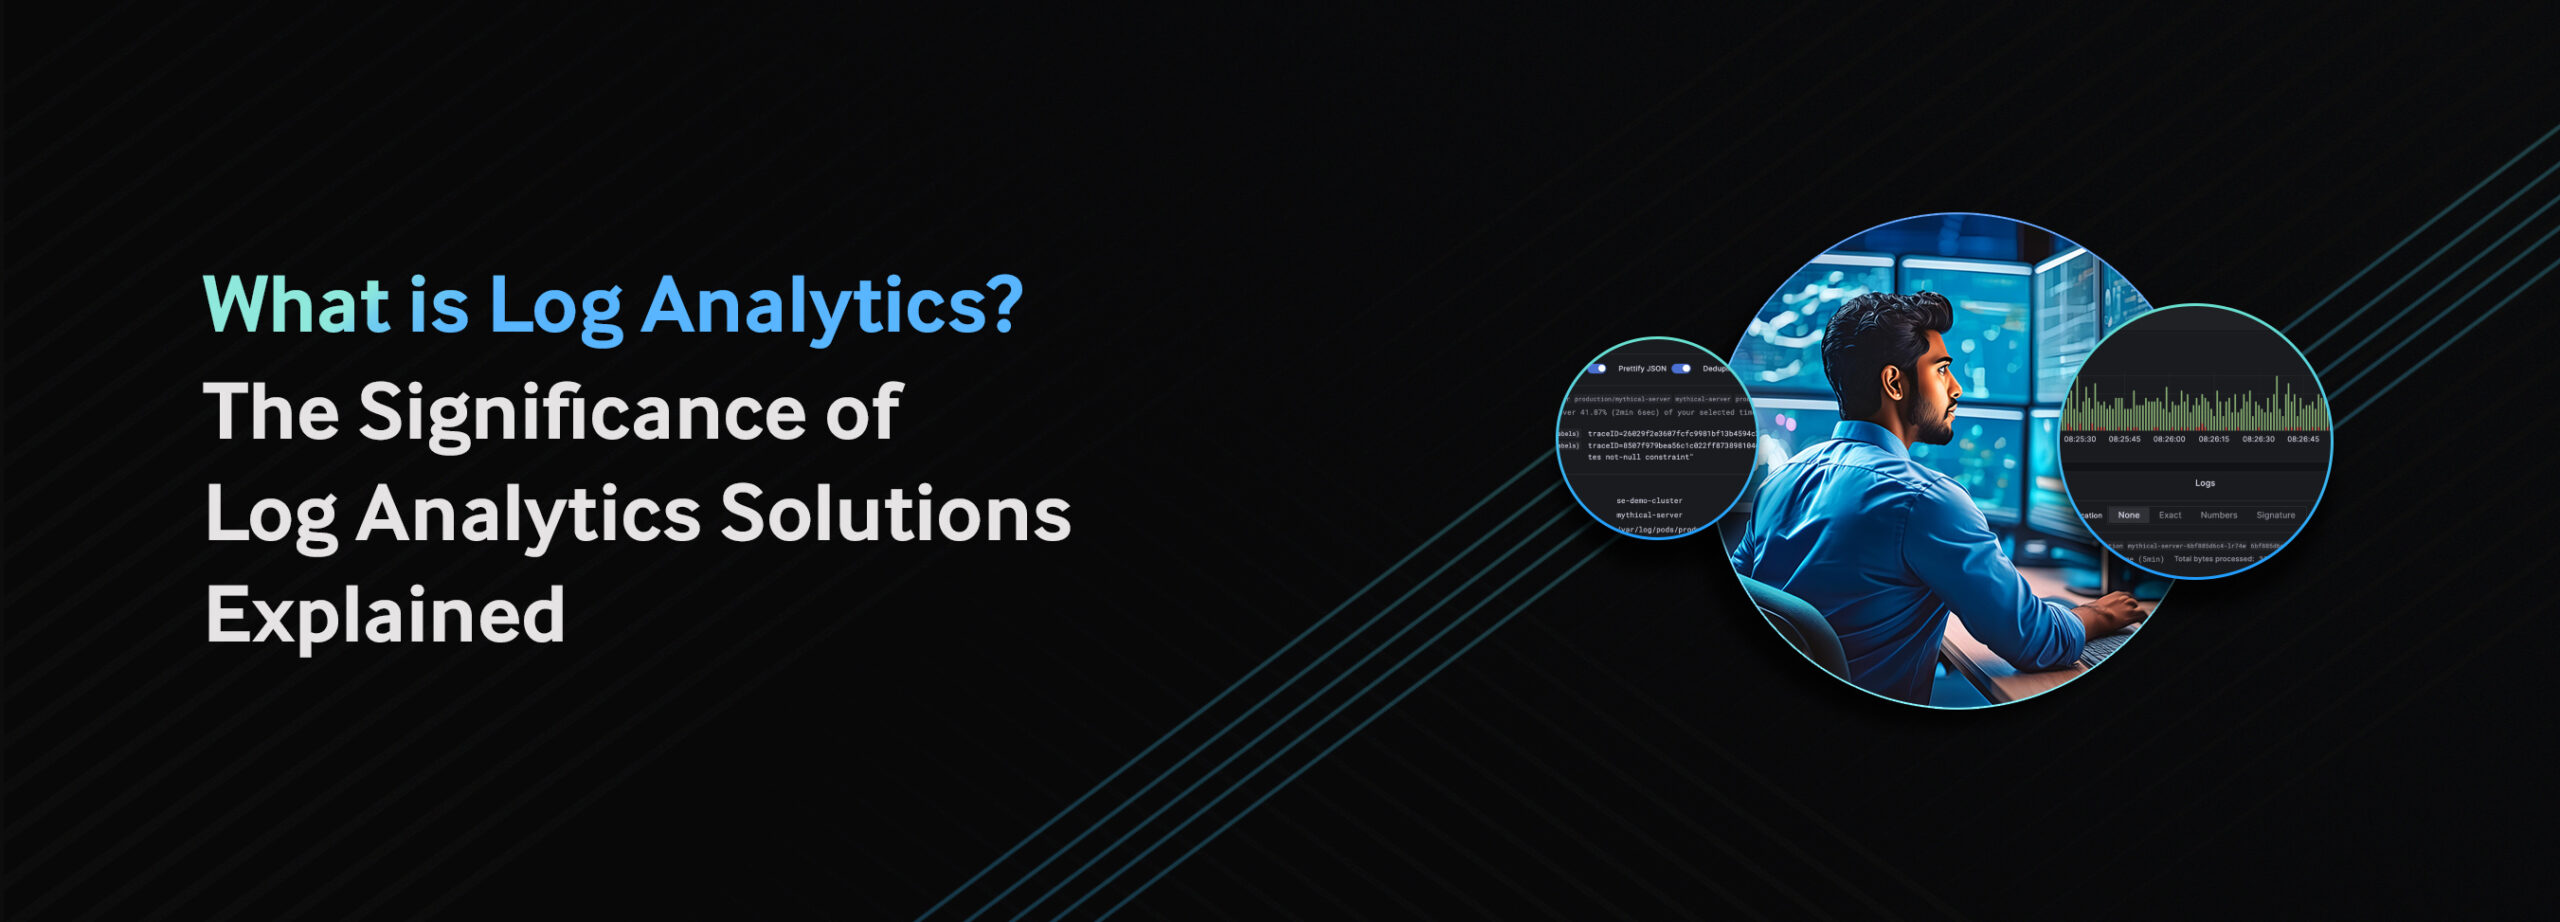
Every action, transaction, and interaction in an application generates some sort of data. ThisAnd this data holds a wealth of information that, when collected and analyzed over a...
Almost everyone acknowledges that log monitoring is essential for maintaining the reliability, security, and performance of modern applications. However, the complexities...
Picture this: A popular ecommerce web application experiences a sudden increase in user complaints concerning slow page load times and errors during the checkout process. Users...
Real User Monitoring (RUM) is a type of performance monitoring that involves tracking and analyzing user interactions with a website or web application in real-time. RUM provides...