With the increasing complexity of modern applications, log management solutions have become synonymous with troubleshooting, monitoring, and ensuring application reliability. Moreover, choosing the right tools can significantly impact your application’s performance, efficiency, and overall operational costs.
Two powerful tools that often come up in these discussions are Grafana Loki and the ELK Stack (consisting of Elasticsearch, Logstash, and Kibana). Each of these tools has its own strengths and unique features, catering to different needs and preferences.
In this blog post, we’ll give you a detailed comparison between these two popular logging solutions so you’ll have a clearer understanding of which one might be the best fit for your specific needs. Whether you’re managing a cloud-native application, dealing with high log volumes, or need a detailed log analysis, here’s what you need to know.
Introduction to Grafana Loki and the ELK Stack
Grafana Loki
Grafana Loki is a relatively new player in the logging space, introduced by Grafana Labs in 2018. Loki is designed to be cost-effective and scalable, focusing on indexing logs in a more efficient manner. Unlike traditional log management systems that index the full text of logs, Loki only indexes logstream metadata and leverages object stores like Amazon S3 for storing chunks of log data. This makes it more resource-efficient and easier to manage at scale.
ELK Stack
The ELK Stack, on the other hand, is a well-established logging solution comprising three main tools: Elasticsearch, Logstash, and Kibana. This trio works in tandem to collect, analyze, and visualize log data. Elasticsearch handles the storage and search capabilities, Logstash is responsible for processing and ingesting logs, and Kibana provides a powerful interface for visualizing the captured data.
Core Differences
Let’s explore some of the core differences between the two logging solutions.
Architecture
Grafana Loki:
Loki’s architecture is inspired by Prometheus, a popular monitoring system. It uses a similar approach to collecting and storing logs, making it a natural choice for users already familiar with Prometheus. The architecture of Loki consists of several components:
- Promtail: An agent responsible for collecting logs from various sources and pushing them to the Loki server.
- Loki server: The main component that stores and indexes logs.
- Grafana: A visualization tool that integrates seamlessly with Loki for querying and displaying log data.
ELK Stack:
The ELK Stack features a more complex architecture due to its three distinct components:
- Elasticsearch: A distributed search engine that stores logs and provides powerful search capabilities.
- Logstash: A log pipeline tool that ingests data from various sources, processes it, and sends it to Elasticsearch.
- Kibana: A visualization and exploration tool for analyzing and visualizing data stored in Elasticsearch.
Indexing and Storage
Grafana Loki:
Loki’s unique approach to indexing only metadata makes it highly efficient in terms of storage and resource utilization. This design choice reduces the operational overhead and makes Loki suitable for environments with high log volumes. Logs are stored in a manner similar to Prometheus metrics, in chunks, and indexed by labels which are user-defined key-value pairs.
ELK Stack:
In contrast, the ELK Stack indexes the full text of logs, resulting in more granular search capabilities but at the cost of higher storage requirements and resource consumption. Elasticsearch uses an inverted index to facilitate fast search operations, and Logstash can process and transform logs before they are indexed.
Scalability
Grafana Loki:
Loki’s lightweight indexing and efficient storage model contribute to its scalability. It can handle large volumes of logs with relatively low infrastructure costs. However, for specific use cases, Loki is known to struggle with performance, particularly when handling large-scale log data, which can manifest as slower query times and increased resource consumption. This presents a significant challenge for organizations relying on efficient log management and analysis. To combat these issues, OpsVerse takes a multi-pronged approach.
Firstly, OpsVerse engineers have spent a lot of time fine-tuning Loki for performance at scale while being agnostic to the log data format itself, be it really long stack traces, standardized logs such as server access logs, JSON/logfmt formatted logs, or even single-word plaintext debug logs. This finetuning allows ObserveNow Loki to perform and scale much more seamlessly than out-of-the-box Loki. For use cases that Loki generally struggles with, such as analytics queries, ObserveNow offers additional built-in modules, such as the Log Analytics module, which work in tandem with Loki – further supplementing its strengths. ObserveNow can also seamlessly integrate Grafana Loki within the ObserveNow observability stack. This consolidation enables the correlation of your log data with your other telemetry information, including systems such as dashboarding and alerting.
ObserveNow is designed to enhance scalability without stepping on performance, ensuring that even as log volumes increase, users can experience faster querying responses and more efficient resource utilization. By leveraging ObserveNow’s capabilities, organizations can overcome the limitations of Grafana Loki and achieve a more reliable and scalable logging solution.
ELK Stack:
The ELK Stack is also scalable, but its resource-intensive nature requires careful planning and management. Elasticsearch clusters can be scaled horizontally by adding more nodes, and Logstash can be scaled by distributing log processing across multiple instances. However, the full-text indexing and resource demands make scaling more complex and costly compared to Loki.
Querying and Visualization
Grafana Loki:
Loki integrates seamlessly with Grafana for querying and visualization. Grafana’s powerful query language, LogQL, is designed specifically for Loki, enabling users to filter and aggregate log data efficiently. Grafana’s intuitive interface and rich visualization options make it easy to create dashboards and monitor log data in real-time.
ELK Stack:
Kibana, the visualization component of the ELK Stack, offers extensive capabilities for querying and visualizing log data. It provides a robust query language called KQL (Kibana Query Language) and supports Elasticsearch’s query DSL (Domain Specific Language). Kibana’s visualization options are diverse, allowing users to create detailed and interactive dashboards.
Ease of Use
Grafana Loki:
Loki’s integration with Grafana simplifies the user experience, especially for those already using Grafana for monitoring metrics. The setup and configuration process are straightforward, and the focus on indexing metadata reduces the complexity of managing the system.
ELK Stack:
The ELK Stack, while powerful, has a steeper learning curve due to its multi-component architecture. Setting up and configuring Elasticsearch, Logstash, and Kibana requires a deeper understanding of each component and its interactions.
Cost Efficiency
Grafana Loki:
Loki’s efficient indexing and storage model translates to lower infrastructure costs. By only indexing metadata, Loki reduces the amount of storage and compute resources needed – making it a cost-effective solution for large-scale log management.
ELK Stack:
The ELK Stack’s full-text indexing provides more detailed search capabilities, but at a higher cost. The increased storage and compute requirements can lead to higher operational expenses. This could result in an unideal situation when scaling infrastructure and resources.
Use Cases
So, in which ideal scenarios can these powerful log management solutions be used to achieve specific goals or tasks? Here are a few.
Grafana Loki:
- Cloud-native environments: Loki’s lightweight architecture and scalability make it ideal for cloud-native applications and microservices architectures.
- Prometheus users: Organizations already using Prometheus for monitoring metrics will find Loki’s similar design and integration with Grafana more beneficial.
- Cost-sensitive projects: Loki’s efficient resource utilization is suitable for projects with budget constraints.
ELK Stack:
- Complex log analysis: The ELK Stack’s full-text indexing and powerful search capabilities make it suitable for environments that require detailed log analysis.
- Extra customization needs: Organizations that need extensive customization and flexibility in their log management setups will benefit from the ELK Stack’s robust features.
- Established ELK users: Existing users of the ELK Stack will continue to find value in its comprehensive log management and analysis capabilities.
Conclusion
When choosing a logging solution, it’s important to consider factors such as cost efficiency, scalability, and usability. Grafana Loki and the ELK Stack both offer robust logging capabilities, but they cater to different needs and come with their own sets of advantages and challenges. Ultimately, Grafana Loki integrated with ObserveNow stands out as the ideal choice for organizations seeking a cost-effective, scalable, and user-friendly logging solution.
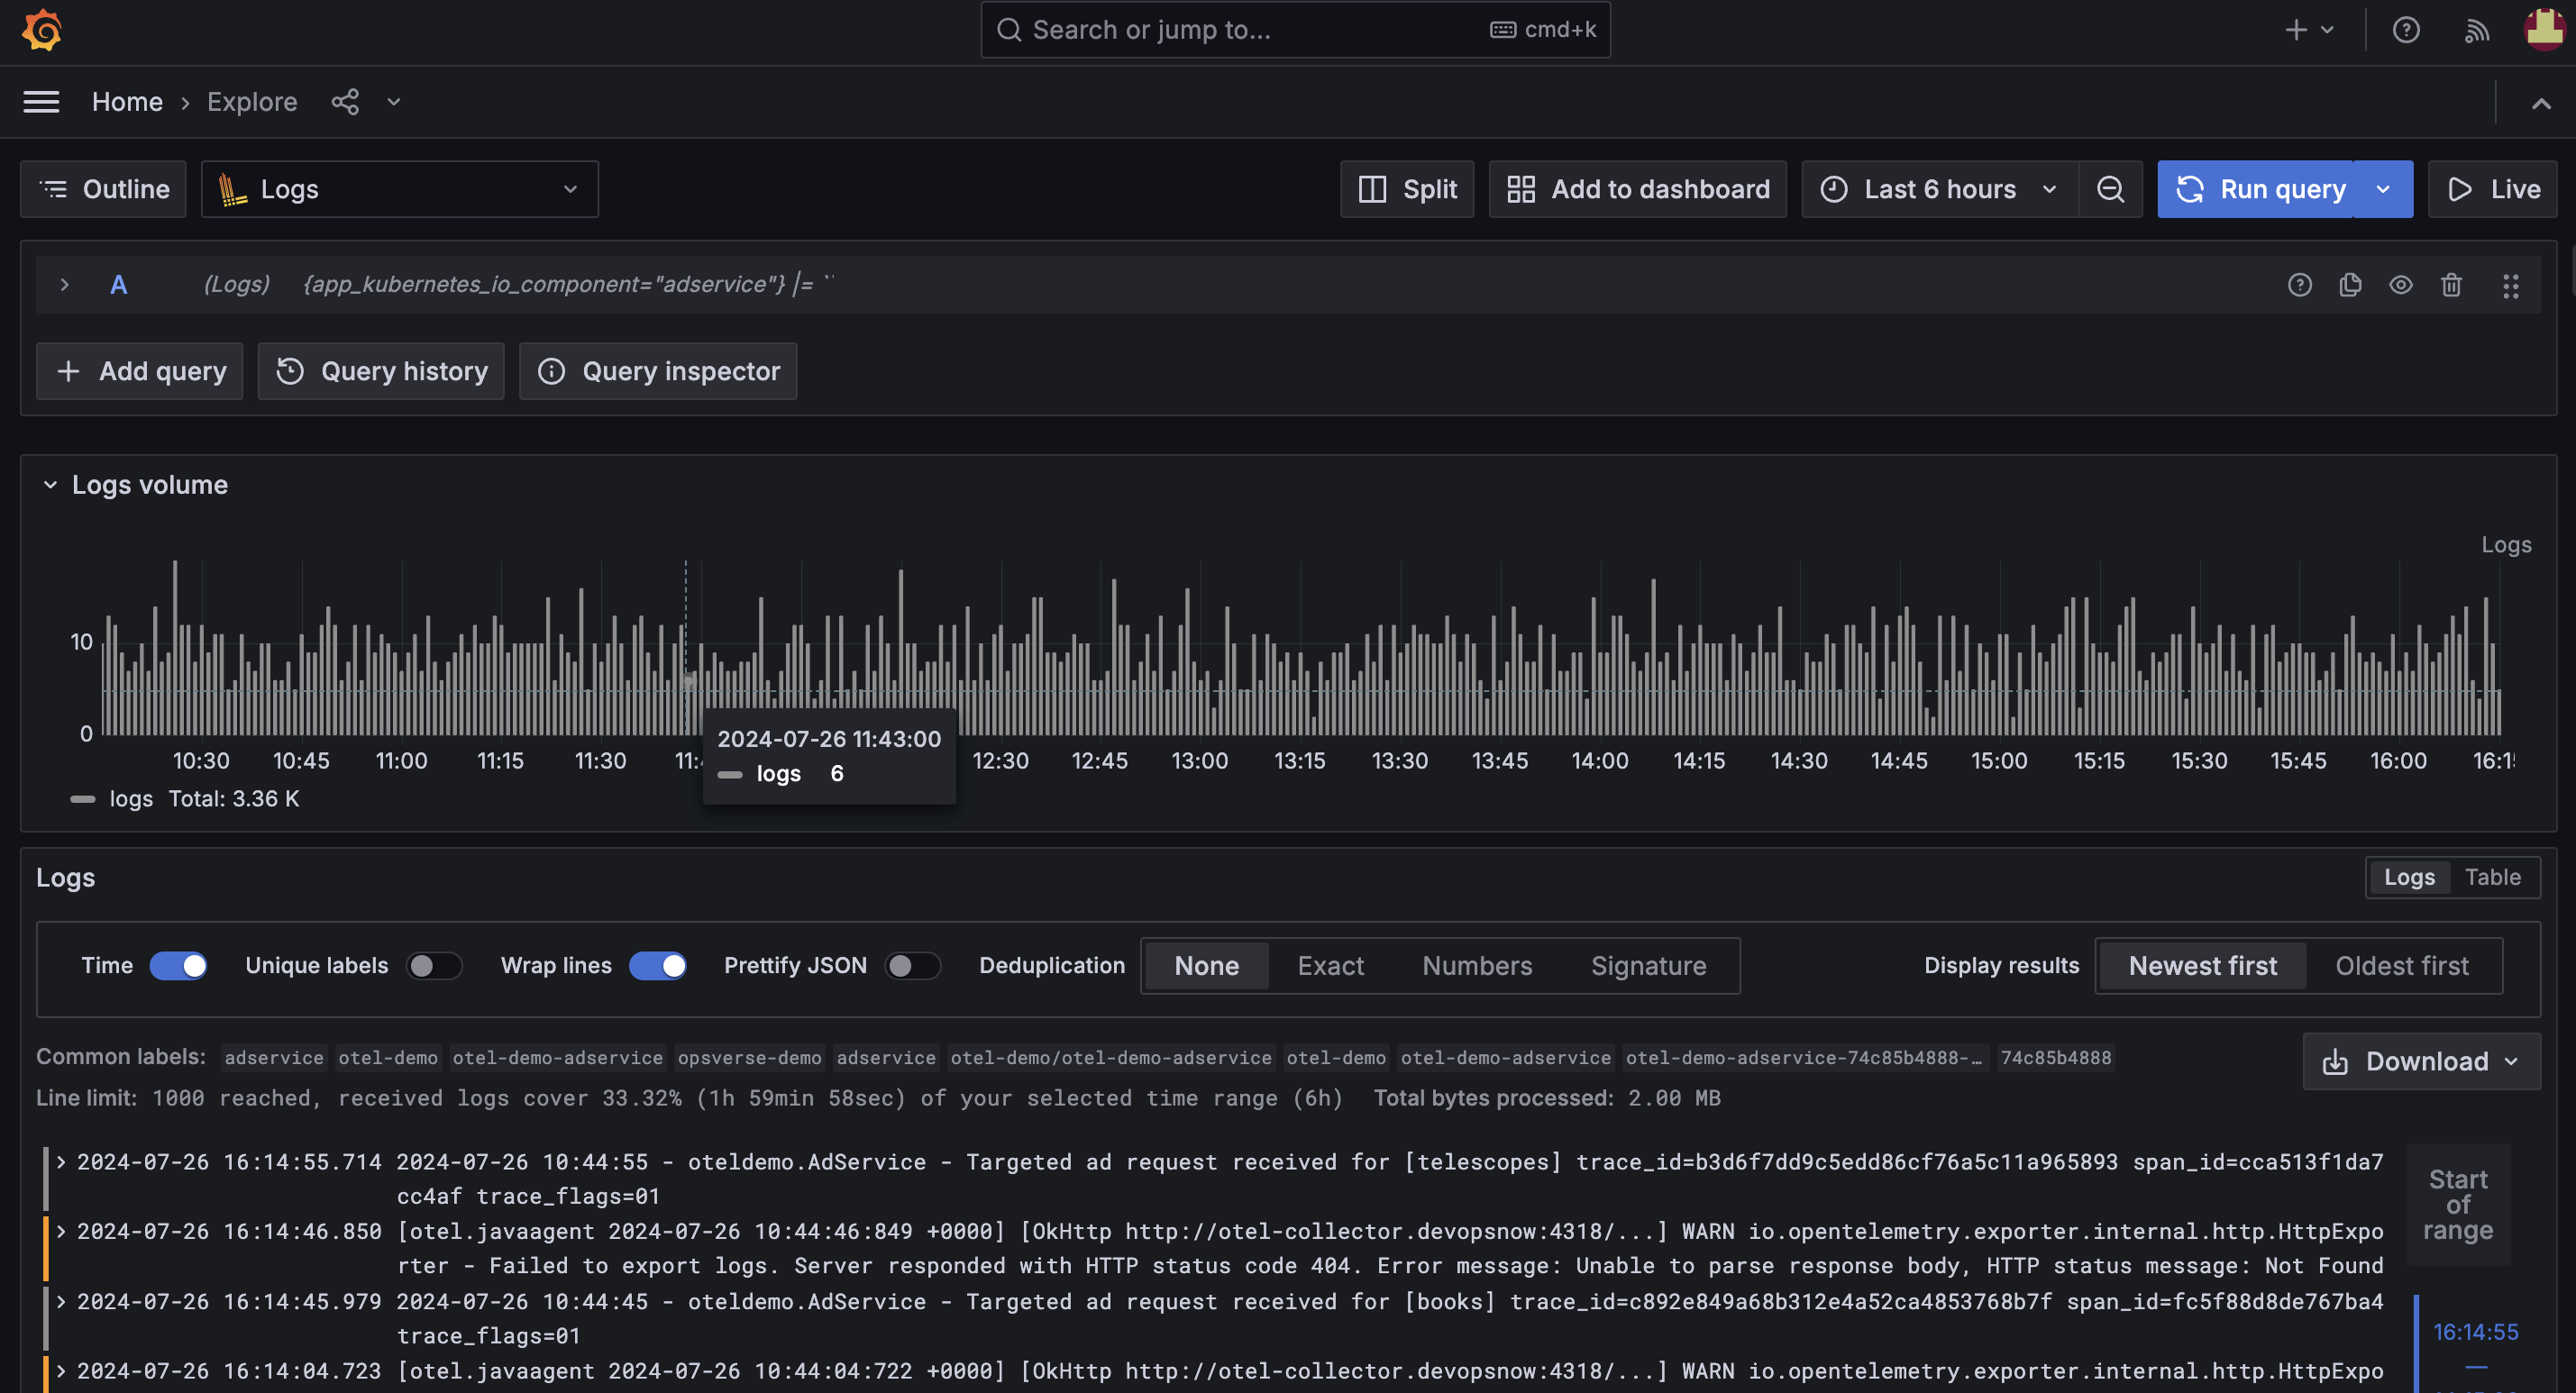
Log Querying With Grafana Loki and ObserveNow Integration
While the ELK Stack remains a powerful tool for detailed log analysis and for environments requiring extensive customization, its higher costs and complexity might be deal-breakers for anyone with a tight budget. By carefully assessing your specific needs and considering the strengths of each solution, you can make an informed decision that best fits your logging and monitoring requirements.
Learn more about how ObserveNow can be your ideal observability solution by talking to our experts today!