
For any digital business today, keeping applications running smoothly and efficiently is a no-brainer. Application Performance Monitoring (APM) is an invaluable process in that regard, helping teams track the performance and health of their software applications. APM involves the use of tools and practices to detect, diagnose, and resolve performance issues in real-time, thereby ensuring optimal user experiences. While there are several commercial APM solutions available on the market today, open-source APM tools are cost-effective and flexible alternatives. In this article, we’ll explore the importance of APM and analyze some popular open-source APM tools.
Why Application Performance Monitoring Is Important
Application Performance Monitoring (APM) is crucial for developers as it offers deep insights into application-level performance, identifying bottlenecks and inefficiencies. Unlike infrastructure monitoring, APM focuses on code-level diagnostics, enabling developers to troubleshoot and optimize applications effectively, ensuring seamless user experiences and robust application health. Some of the key ways APM helps organizations are:
- Optimizing the User Experience: Performance issues can lead to slow response times, errors, and downtime – all of which negatively impact user experience. APM helps in identifying and resolving these issues promptly.
- Maximizing Business Impact: Poor application performance can lead to loss of revenue, especially for e-commerce platforms. APM is a great way to ensure that applications run optimally, thus protecting the business’s bottom line.
- Proactive Issue Resolution: With APM, teams can proactively detect and address potential problems before they affect end-users.
- Resource Optimization: By monitoring application performance, organizations can better understand resource utilization and optimize their infrastructure accordingly.
Key Features of APM Tools
Effective APM tools typically offer a suite of integrated features designed to ensure optimal application performance and reliability. These include:
- Real-time Monitoring: Real-time Monitoring: The continuous monitoring of application performance metrics means any issues are immediately identified. By tracking metrics such as response times, request rates, and error rates in real-time, teams can quickly pinpoint and respond to performance degradations or failures as they happen.
- Transaction Tracing: This feature involves tracking individual transactions as they move through the various components of an application. It helps diagnose bottlenecks by pointing to where exactly delays or issues occur, be they in the mobile application, web browser, web server, application code, or database.
- Error Detection: Maintaining application stability means identifying and alerting on errors and exceptions. By capturing error logs, stack traces, and specific error codes, APM tools let teams quickly troubleshoot and resolve issues that could negatively impact the user experience.
- Resource Usage Monitoring: Monitoring the usage of system resources like CPU, memory, disk I/O, and network bandwidth helps visualize resource consumption patterns. This allows teams to detect resource-related issues such as memory leaks or CPU spikes while optimally allocating resources.
- Alerting and Reporting: Configurable alerts notify teams about critical issues, such as high CPU usage or increased error rates, while detailed performance reports provide insights into long-term trends. This combination ensures that issues are addressed promptly while facilitating data-driven decision-making
- Dashboard Visualization: User-friendly dashboards display performance metrics in an easily understandable format using graphs, charts, and other visual aids. This provides an at-a-glance overview of application health, making it easier to spot trends and anomalies and quickly assess the impact of performance optimizations.
Popular Open-Source APM Tools
At the core of any APM solution is the collection and processing of distributed traces, offering insights into request flows and identifying performance bottlenecks. OpenTelemetry has become the industry standard for this task, enabling effective monitoring and troubleshooting of distributed systems. Popular tools providing these capabilities include:
1. Jaeger
Jaeger, originally developed by Uber Technologies, is an open-source, end-to-end distributed tracing tool. It helps in monitoring and troubleshooting microservices-based distributed systems. It is also highly effective for tracing the flow of requests across microservices, identifying latency issues, and understanding service dependencies. However, it is important to note that while Jaeger excels at collecting traces, it does not provide analytics on top of them. While Jaeger can collect and visualize trace data, it lacks built-in advanced analytical capabilities to derive deeper insights, trends, or patterns from the collected data. Users often need to integrate Jaeger with other tools or platforms that offer more robust analytics and visualization features to fully leverage the trace data for comprehensive performance monitoring and optimization.
Key features of Jaeger are:
- Distributed context propagation
- Distributed transaction monitoring
- Root cause analysis
- Performance optimization
2. Elastic Stack (ELK)
Elastic Stack, commonly referred to as ELK (Elasticsearch, Logstash, and Kibana), is a powerful combination of tools for searching, analyzing, and visualizing log data in real-time. ELK is most suitable for identifying and diagnosing application performance issues. Originally designed for processing logs, ELK has grown to handle a wide range of data types and use cases. However, it is important to highlight that maintaining an ELK stack can be costly, both in terms of infrastructure and operational overhead.
Setting up and managing Elasticsearch clusters requires significant hardware resources and expertise in cluster management. Additionally, ensuring the scalability and reliability of the stack can add to the operational costs, including monitoring, maintenance, and updates to keep the stack secure and efficient.
Key features of ELK are:
- Elasticsearch: Scalable search and analytics engine
- Logstash: Data processing pipeline for collecting and parsing logs
- Kibana: Visualization layer for exploring and visualizing data
3. Uptrace
Uptrace is an APM tool designed for modern cloud-native environments. It offers distributed tracing, error tracking, and performance metrics, aiding in real-time monitoring, debugging, and optimizing application performance across microservices architectures.
Key features of Uptrace are:
- Distributed Tracing: Detailed insights into requests across microservices.
- Error Tracking: Real-time monitoring and alerts for application errors.
- Performance Metrics: Metrics to optimize application performance.
- Cloud-Native Support: Tailored for modern cloud environments.
- Integration: Seamless integration with various frameworks and languages.
An Overview of the APM Workflow in ObserveNow
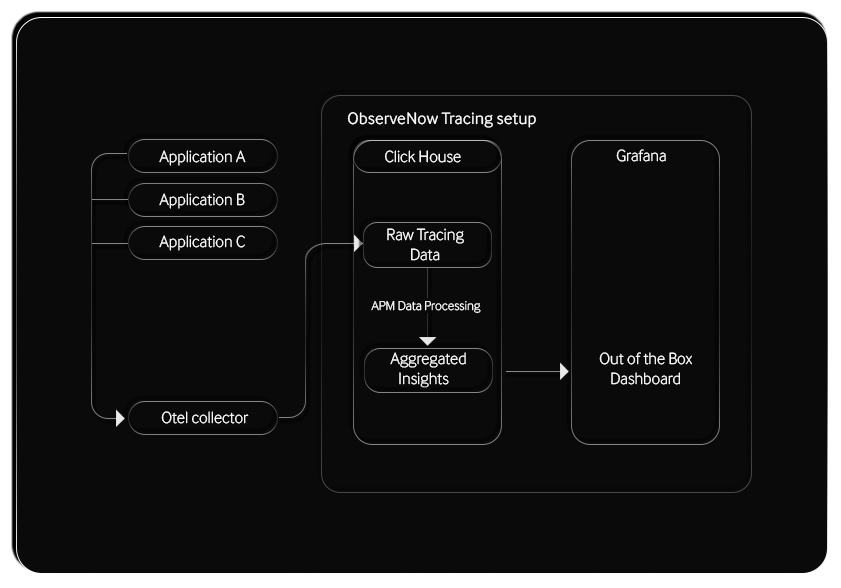
ObserveNow, the leading open-source observability stack, supports comprehensive application performance monitoring with tools such as ClickHouse, OpenTelemetry, and Grafana. It integrates ClickHouse for scalable analysis of distributed traces, complementing OpenTelemetry’s industry-standard capabilities in monitoring and troubleshooting distributed systems. Below is a graphical representation of the APM workflow in ObserveNow.
Here’s a detailed breakdown of each component and how it contributes to effective APM:
1. Applications (A, B, C)
These represent different applications in your infrastructure that need monitoring. Each application generates tracing data as it processes requests.
2. Otel Collector
The Otel (OpenTelemetry) Collector acts as a central point for collecting tracing data from various applications. It performs the following functions:
- Data collection: Gathers tracing data from Applications A, B, and C.
- Data exporting: Forwards the collected tracing data to ClickHouse for storage and processing.
3. ClickHouse
ClickHouse is a high-performance database designed for analytical queries. In the ObserveNow setup, it handles two main types of data:
- Raw tracing Data: Stores the raw tracing data received from the Otel Collector.
- APM data processing: Processes the raw data to generate aggregated insights. This involves analyzing the traces to derive metrics like response times, error rates, and request volumes.
4. Grafana
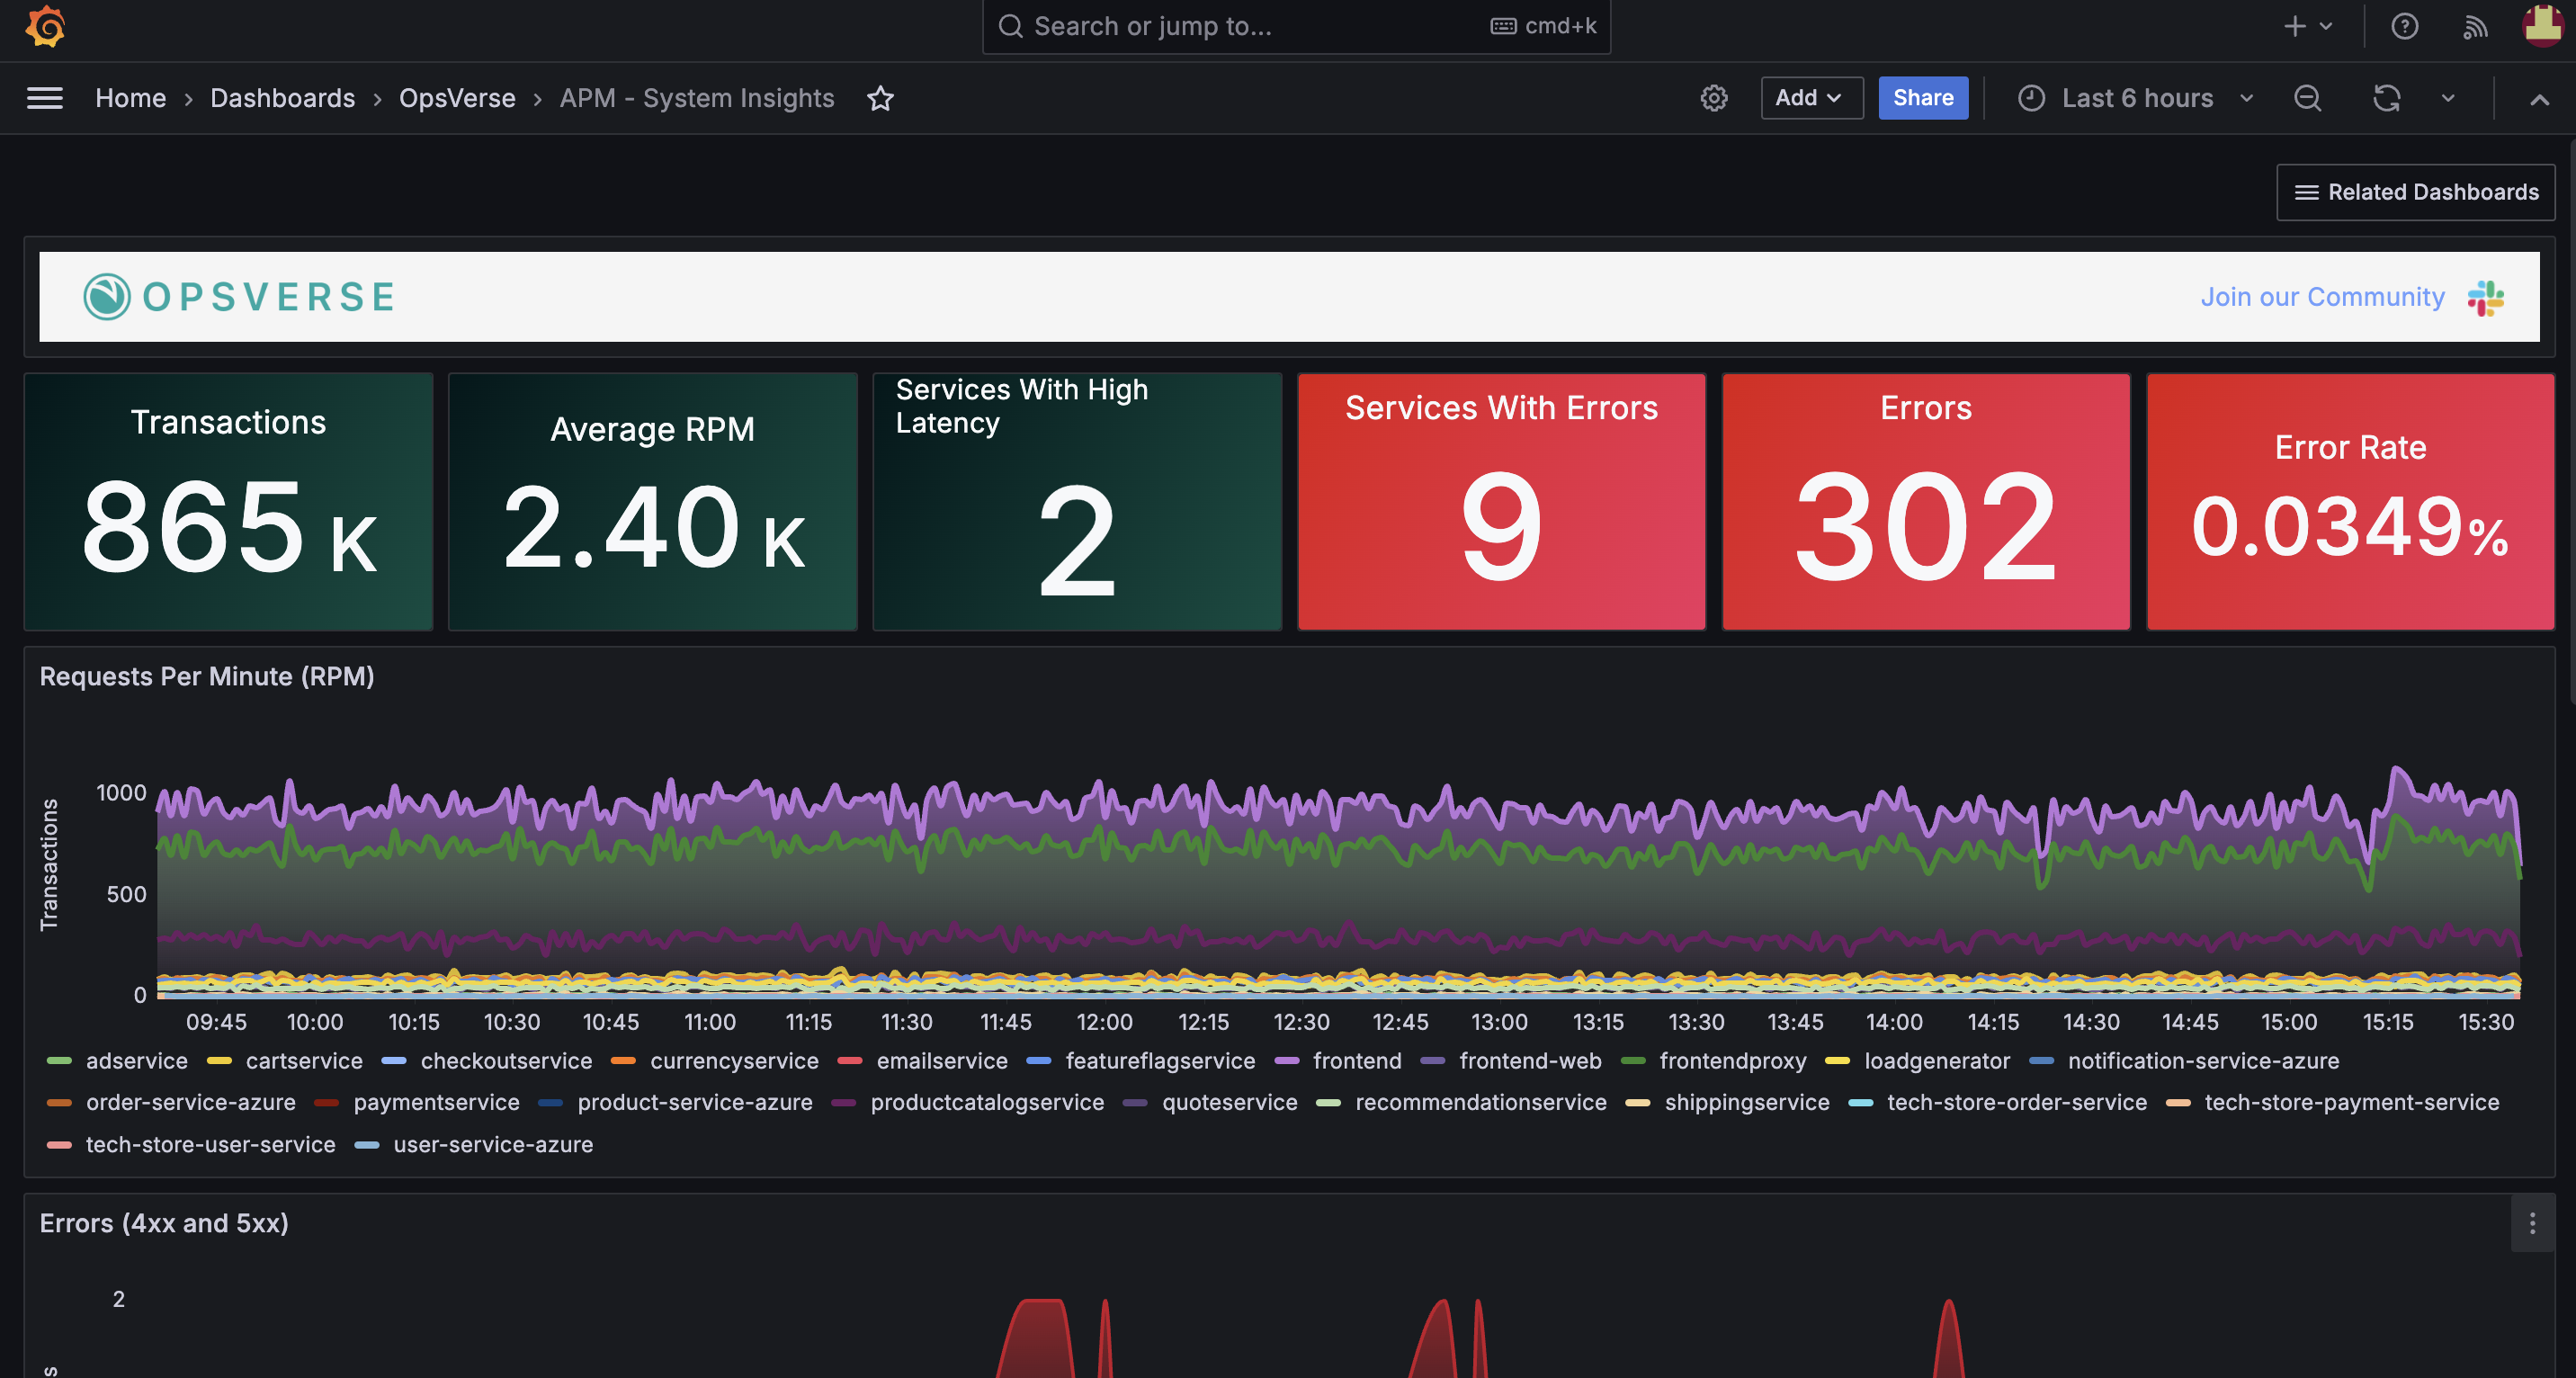
Grafana is a powerful visualization tool that displays the processed data in an easy and understandable format. ObserveNow coupled with Grafana provides pre-configured dashboards that visualize key performance metrics. These dashboards help in monitoring the health and performance of applications. Users can also create custom dashboards tailored to their specific needs, allowing for even further flexible and detailed monitoring.
Here’s a quick view of the APM – System Insights Dashboard in ObserveNow.
Leveraging ObserveNow for Peak APM Efficiency
Now that you’ve seen how each component contributes to effective application performance monitoring in ObserveNow’s detailed APM workflow, let’s now explore the specific benefits and capabilities that make ObserveNow the go-to APM solution for many forward-thinking businesses today.
Centralized Data Collection and Processing
- The Otel Collector consolidates tracing data from multiple applications, drastically simplifying the data collection process.
- ClickHouse efficiently stores and processes large volumes of tracing data, enabling quick retrieval and analysis.
Real-time Performance Monitoring
- The real-time collection and processing of tracing data allow for the immediate detection of performance issues.
- Grafana dashboards provide up-to-date visual insights into application performance, facilitating rapid response to anomalies.
Root Cause Analysis
- By capturing detailed tracing information, ObserveNow can identify the exact source of performance bottlenecks.
- The aggregation of tracing data into insightful metrics allows for a deeper understanding of the underlying causes of performance problems.
Enhanced Visibility
- Out-of-the-box dashboards in Grafana offer comprehensive visibility into application health without requiring extensive setup.
- Customizable dashboards provide the flexibility needed to monitor specific aspects of application performance that are critical to the organization.
Scalability
- Using ClickHouse for data storage and processing ensures that observability stacks can scale parallel to the increasing amounts of tracing data generated by applications.
- The Otel Collector’s capability to handle data from multiple applications supports scalable monitoring solutions.
With these comprehensive features packaged into a single, convenient piece of software, ObserveNow stands as the ultimate solution for organizations seeking to optimize their application performance efforts, maintain high reliability, and deliver an exceptional user experience. Learn more about how ObserveNow can help with your APM requirements by speaking to our experts.


