ObserveNow, the leading open source-based observability stack, has recently enhanced its capabilities with the introduction of Span Filtering – a key feature in its latest upgrade to Grafana 10.4. This advancement significantly improves the platform’s ability to dissect and analyze traces, which are crucial for understanding the behavior and performance of distributed systems. In this blog post, we’ll discuss what traces and spans are in addition to how Span Filtering can empower developers to gain deeper insights into application and system performance.
What Are Traces and Spans?
A trace represents the journey of a single request as it traverses through different services and components in a distributed system. It is essentially a record of the entire transaction, capturing each step and interaction from start to finish. Traces are invaluable for understanding how a request is processed, identifying bottlenecks, and diagnosing errors.
Within a trace, each operation or step is recorded as a span. A span contains detailed information about a specific part of the workflow, including:
- Start and end time: When the operation began and ended
- Duration: How long the operation took
- Service and operation name: Identifying the component and action
- Tags and metadata: Additional contextual information
By breaking down a trace into spans, developers and operators can see exactly what happens at each stage of a request, making it easier to pinpoint issues and understand the system’s behavior.
The Role of Span Filtering
As systems become more complex, traces can contain a large number of spans. The sheer volume of data can make it difficult to isolate and analyze specific parts of a request. This is where Span Filtering comes into play. Span Filtering allows users to apply various criteria to focus on particular spans within a trace, providing a more granular level of analysis.
With the Grafana 10.4 upgrade, Span Filtering can officially be enabled within ObserveNow, allowing users to isolate and examine specific spans within a trace. Here’s how span filtering enhances the observability experience:
- Targeted analysis: Users can filter spans based on specific criteria, such as service name, operation type, duration, tags, and other attributes. This targeted approach simplifies pinpointing issues within a complex trace, making it easier to identify bottlenecks or errors in specific parts of the system.
- Performance optimization: By focusing on particular spans, users can better understand performance characteristics and dependencies. This can lead to more effective optimization efforts as engineers can see exactly where latency or performance degradation occur within a request’s lifecycle.
- Error detection and troubleshooting: Span filtering helps in quickly locating spans that are associated with errors or anomalies. This reduces the time it takes to diagnose and resolve issues, enhancing the overall reliability of the system.
- Enhanced visualization: With Grafana’s robust visualization capabilities, filtered spans can be presented in a clear and meaningful way. Users can create customized dashboards that highlight critical spans, making it easier to monitor and analyze specific parts of their infrastructure.
Implementing Span Filtering in ObserveNow
Utilizing Span Filtering in Grafana 10.4 with ObserveNow is easy. Just follow these steps:
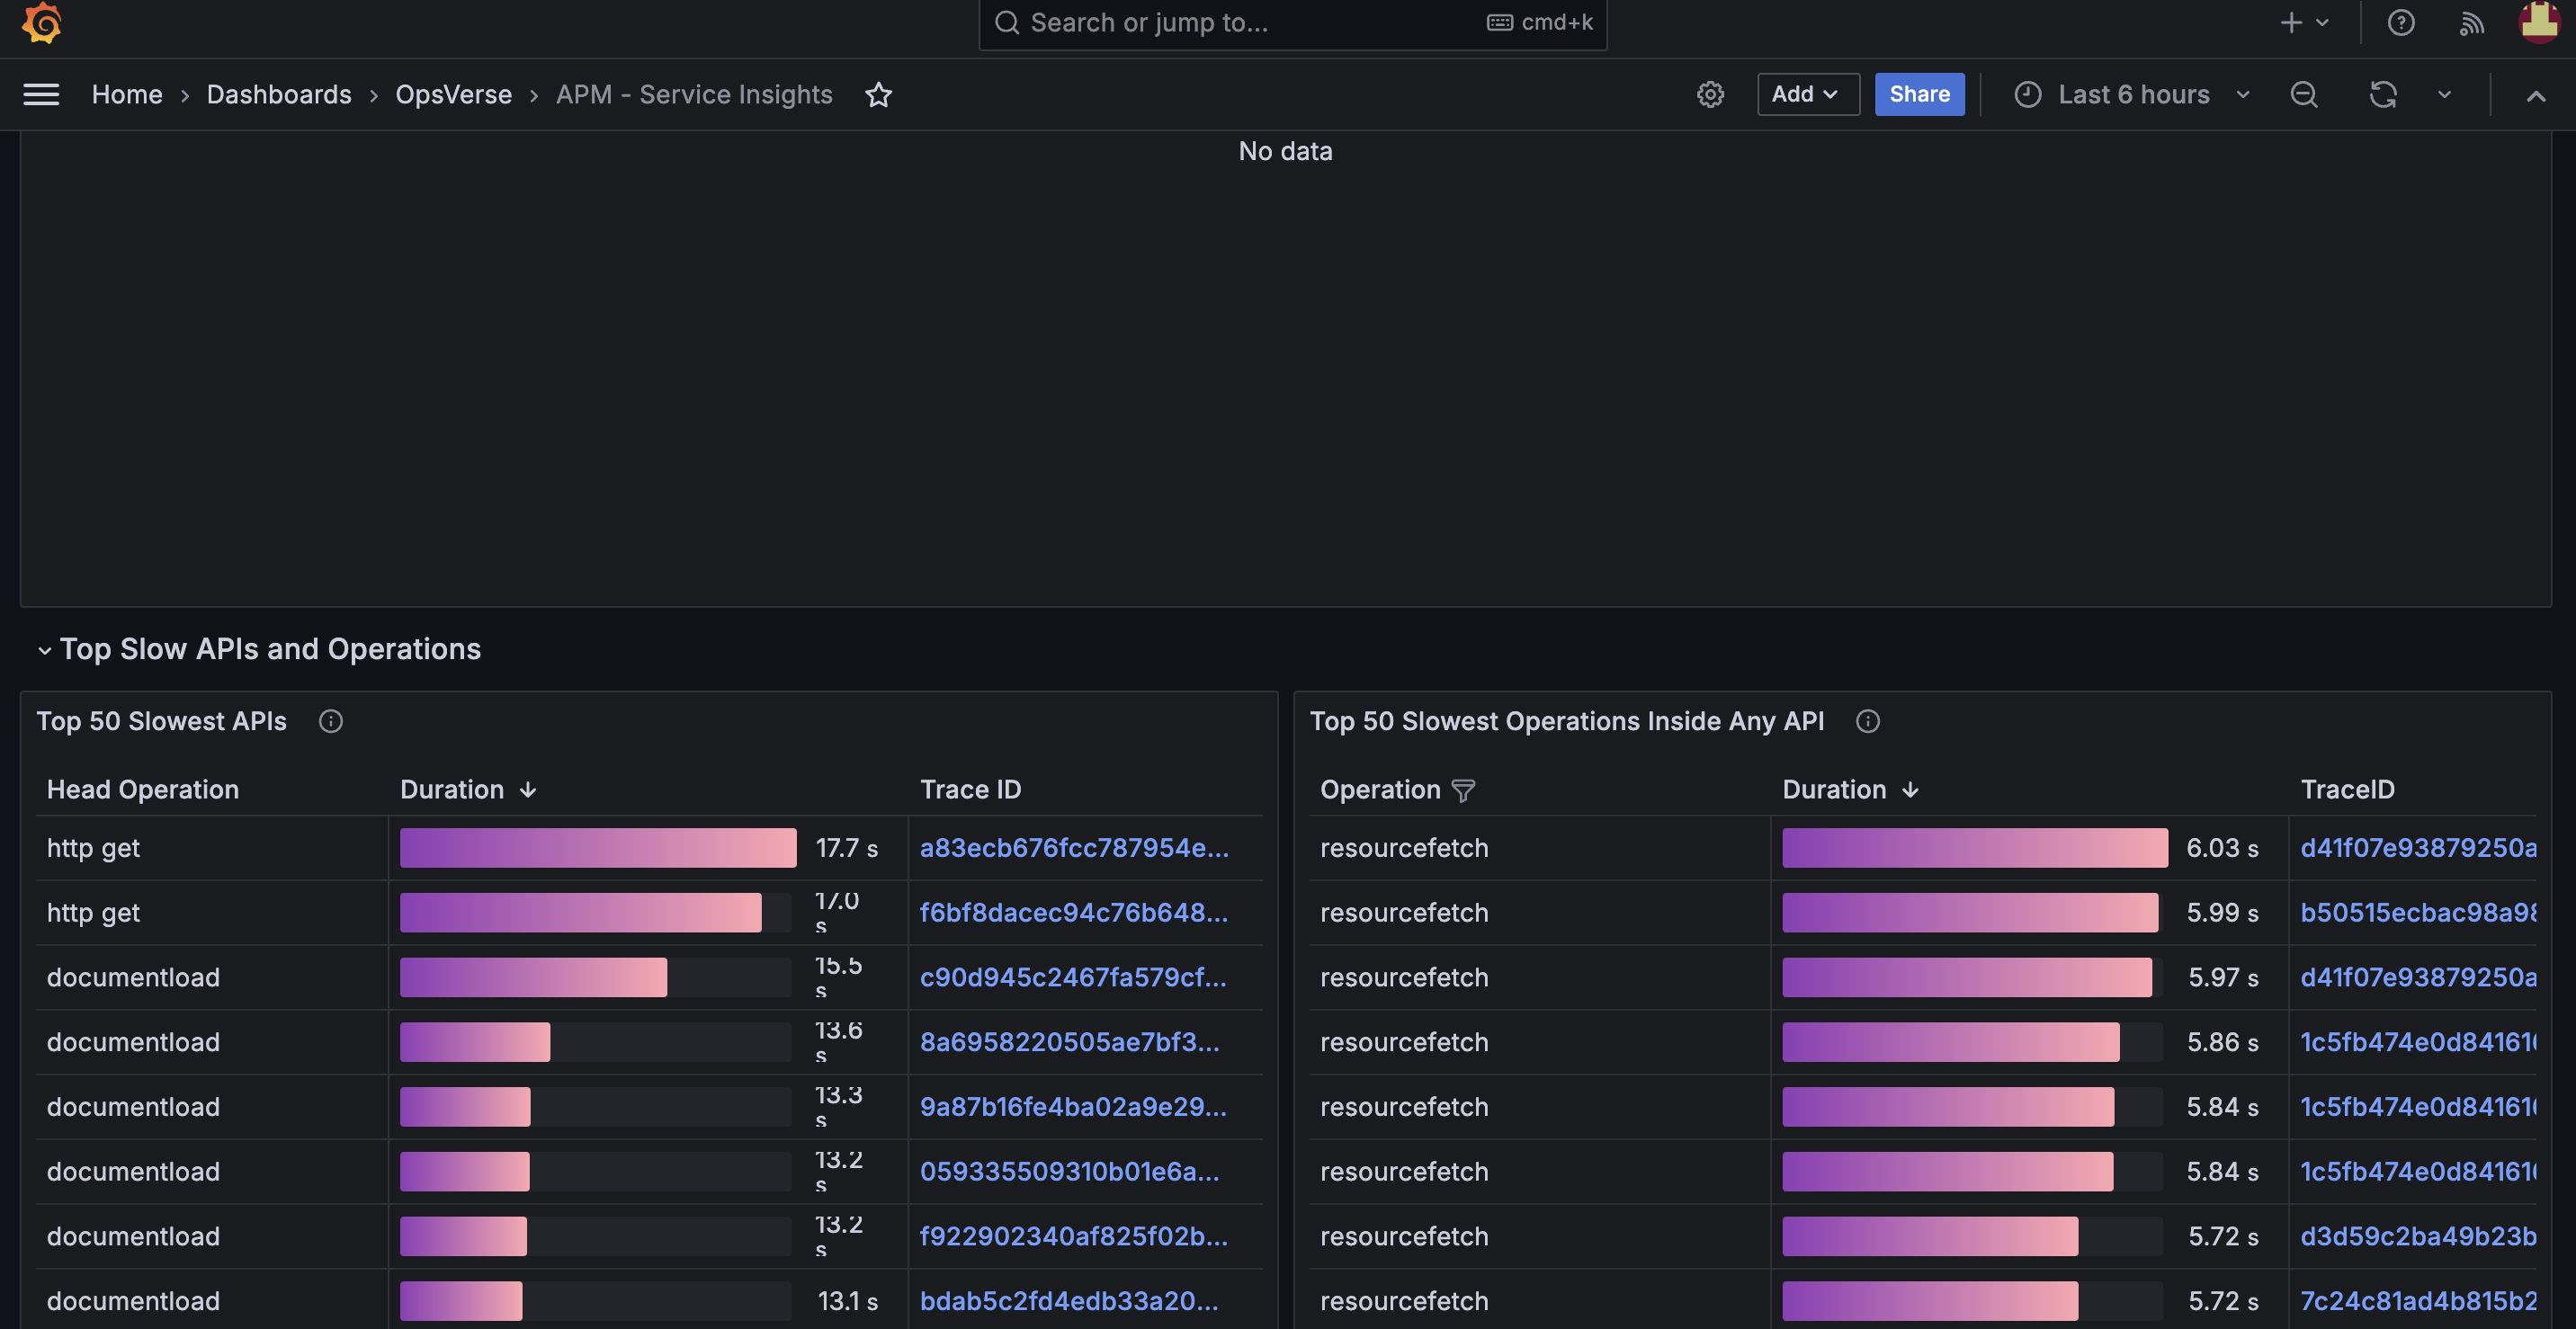
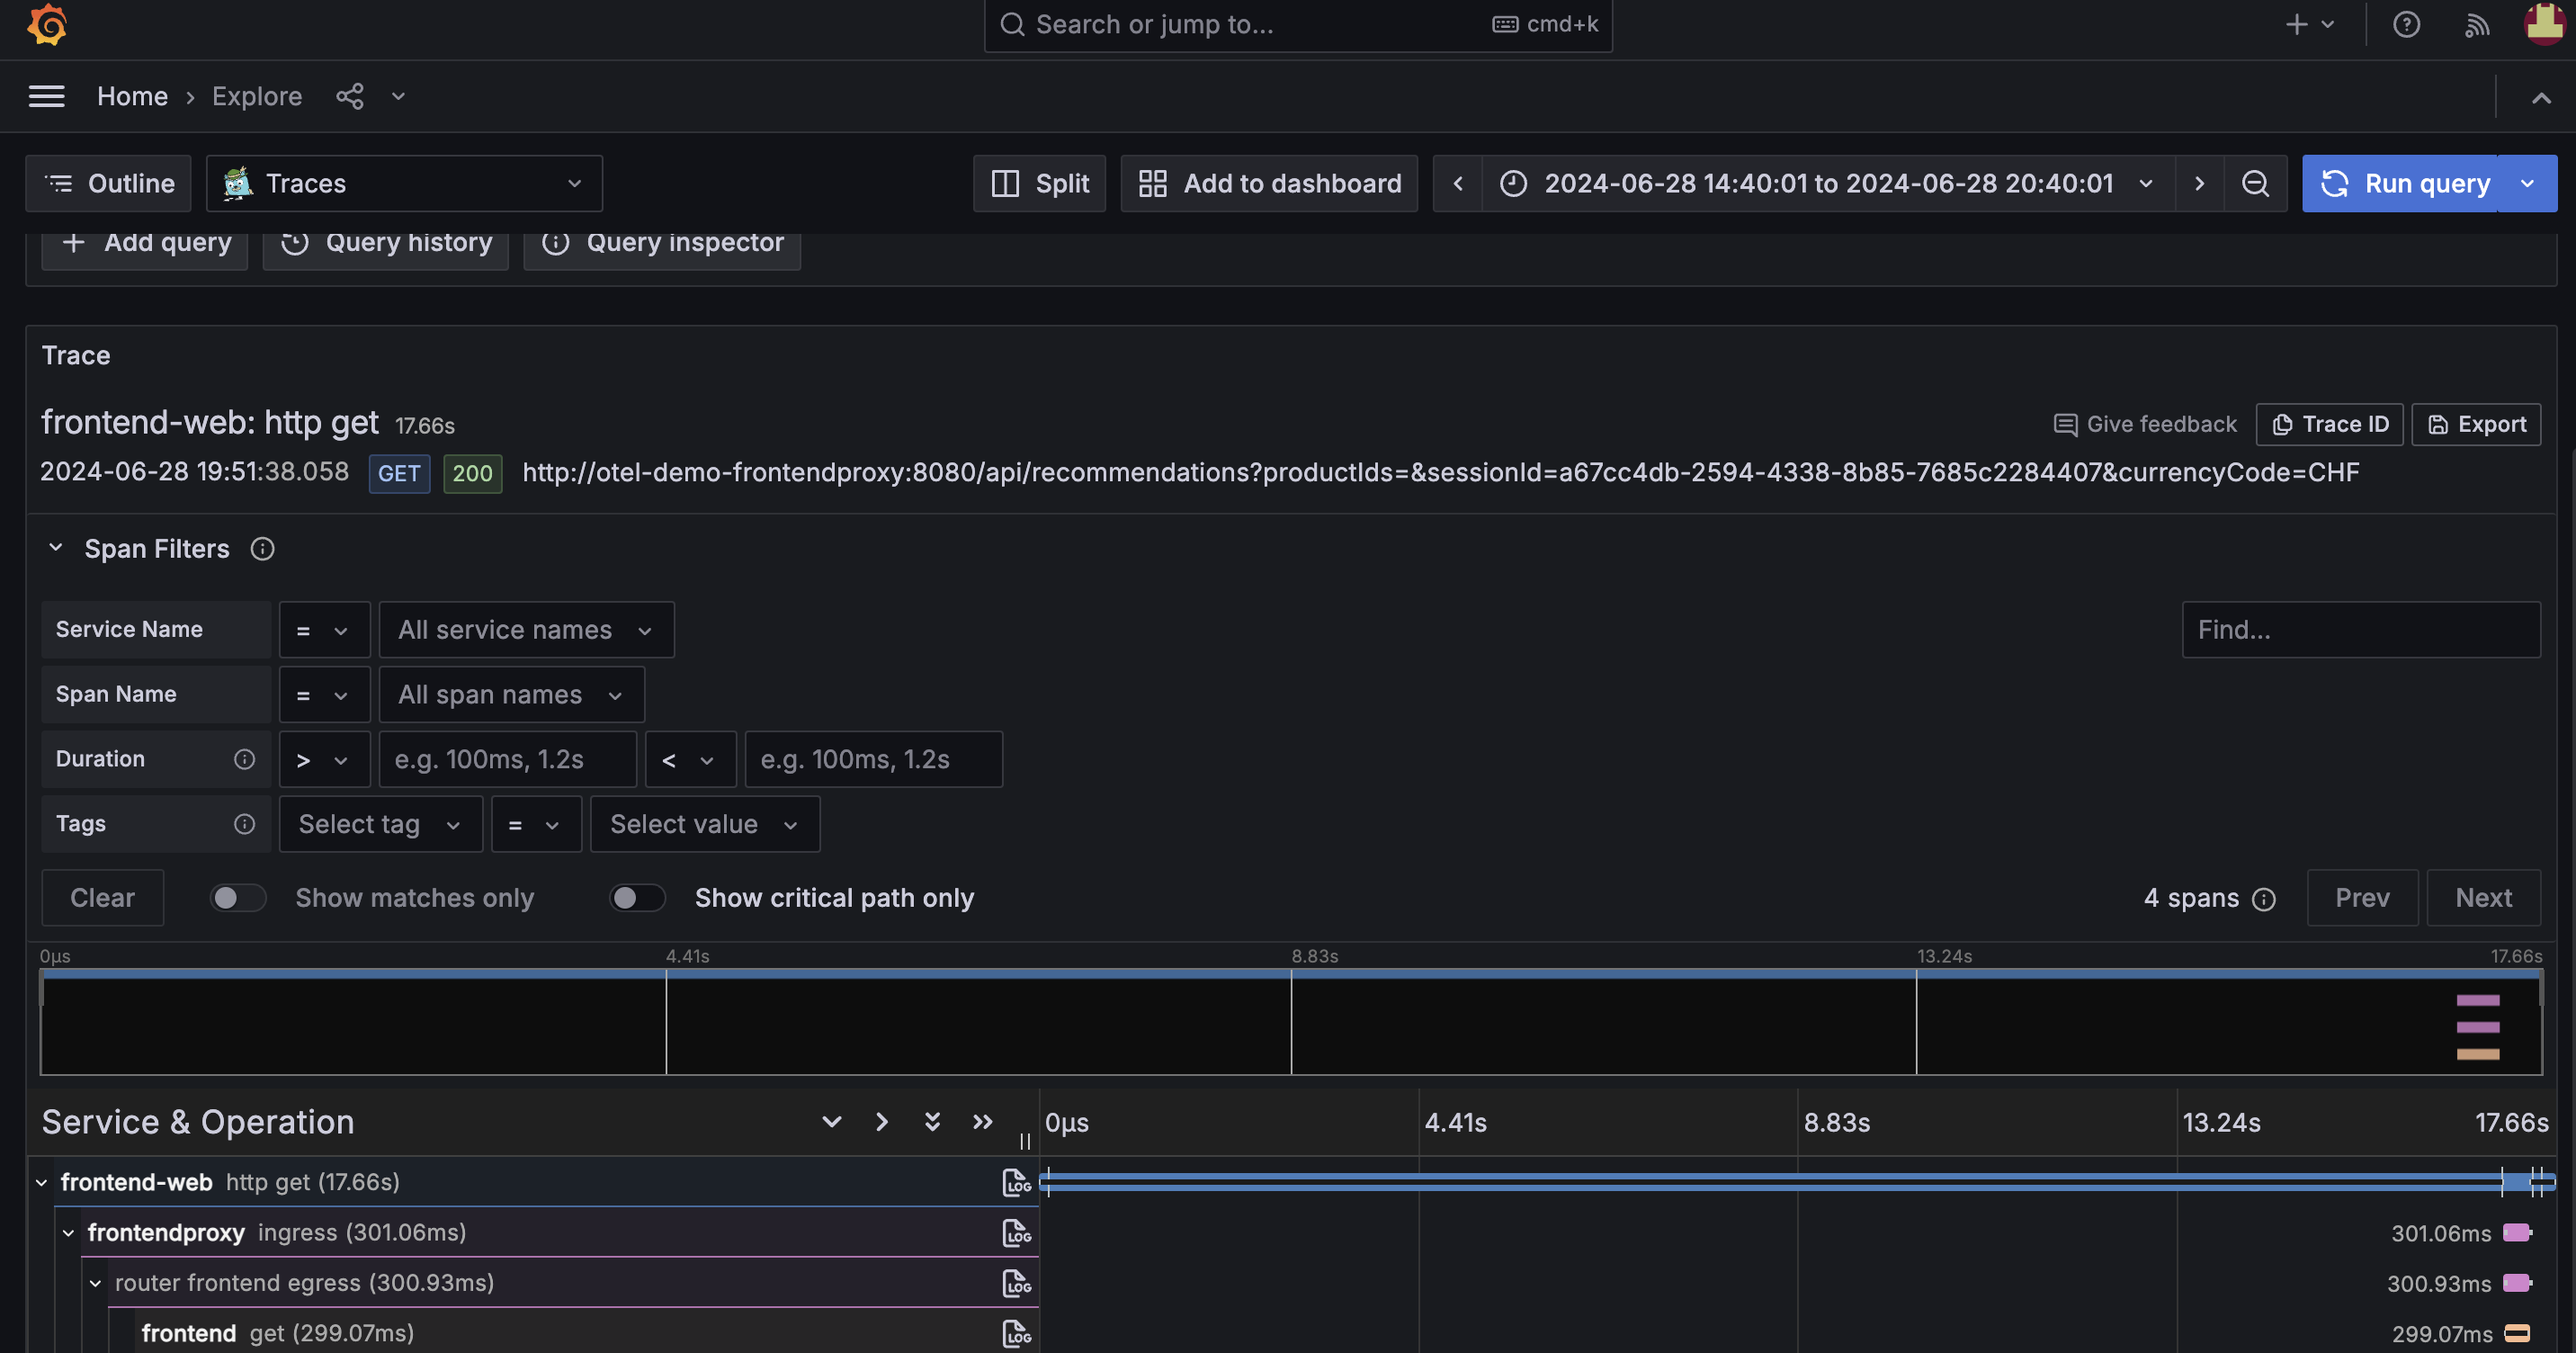
1. Start by navigating to the Traces View dashboard in the Grafana portal where all collected traces are displayed.
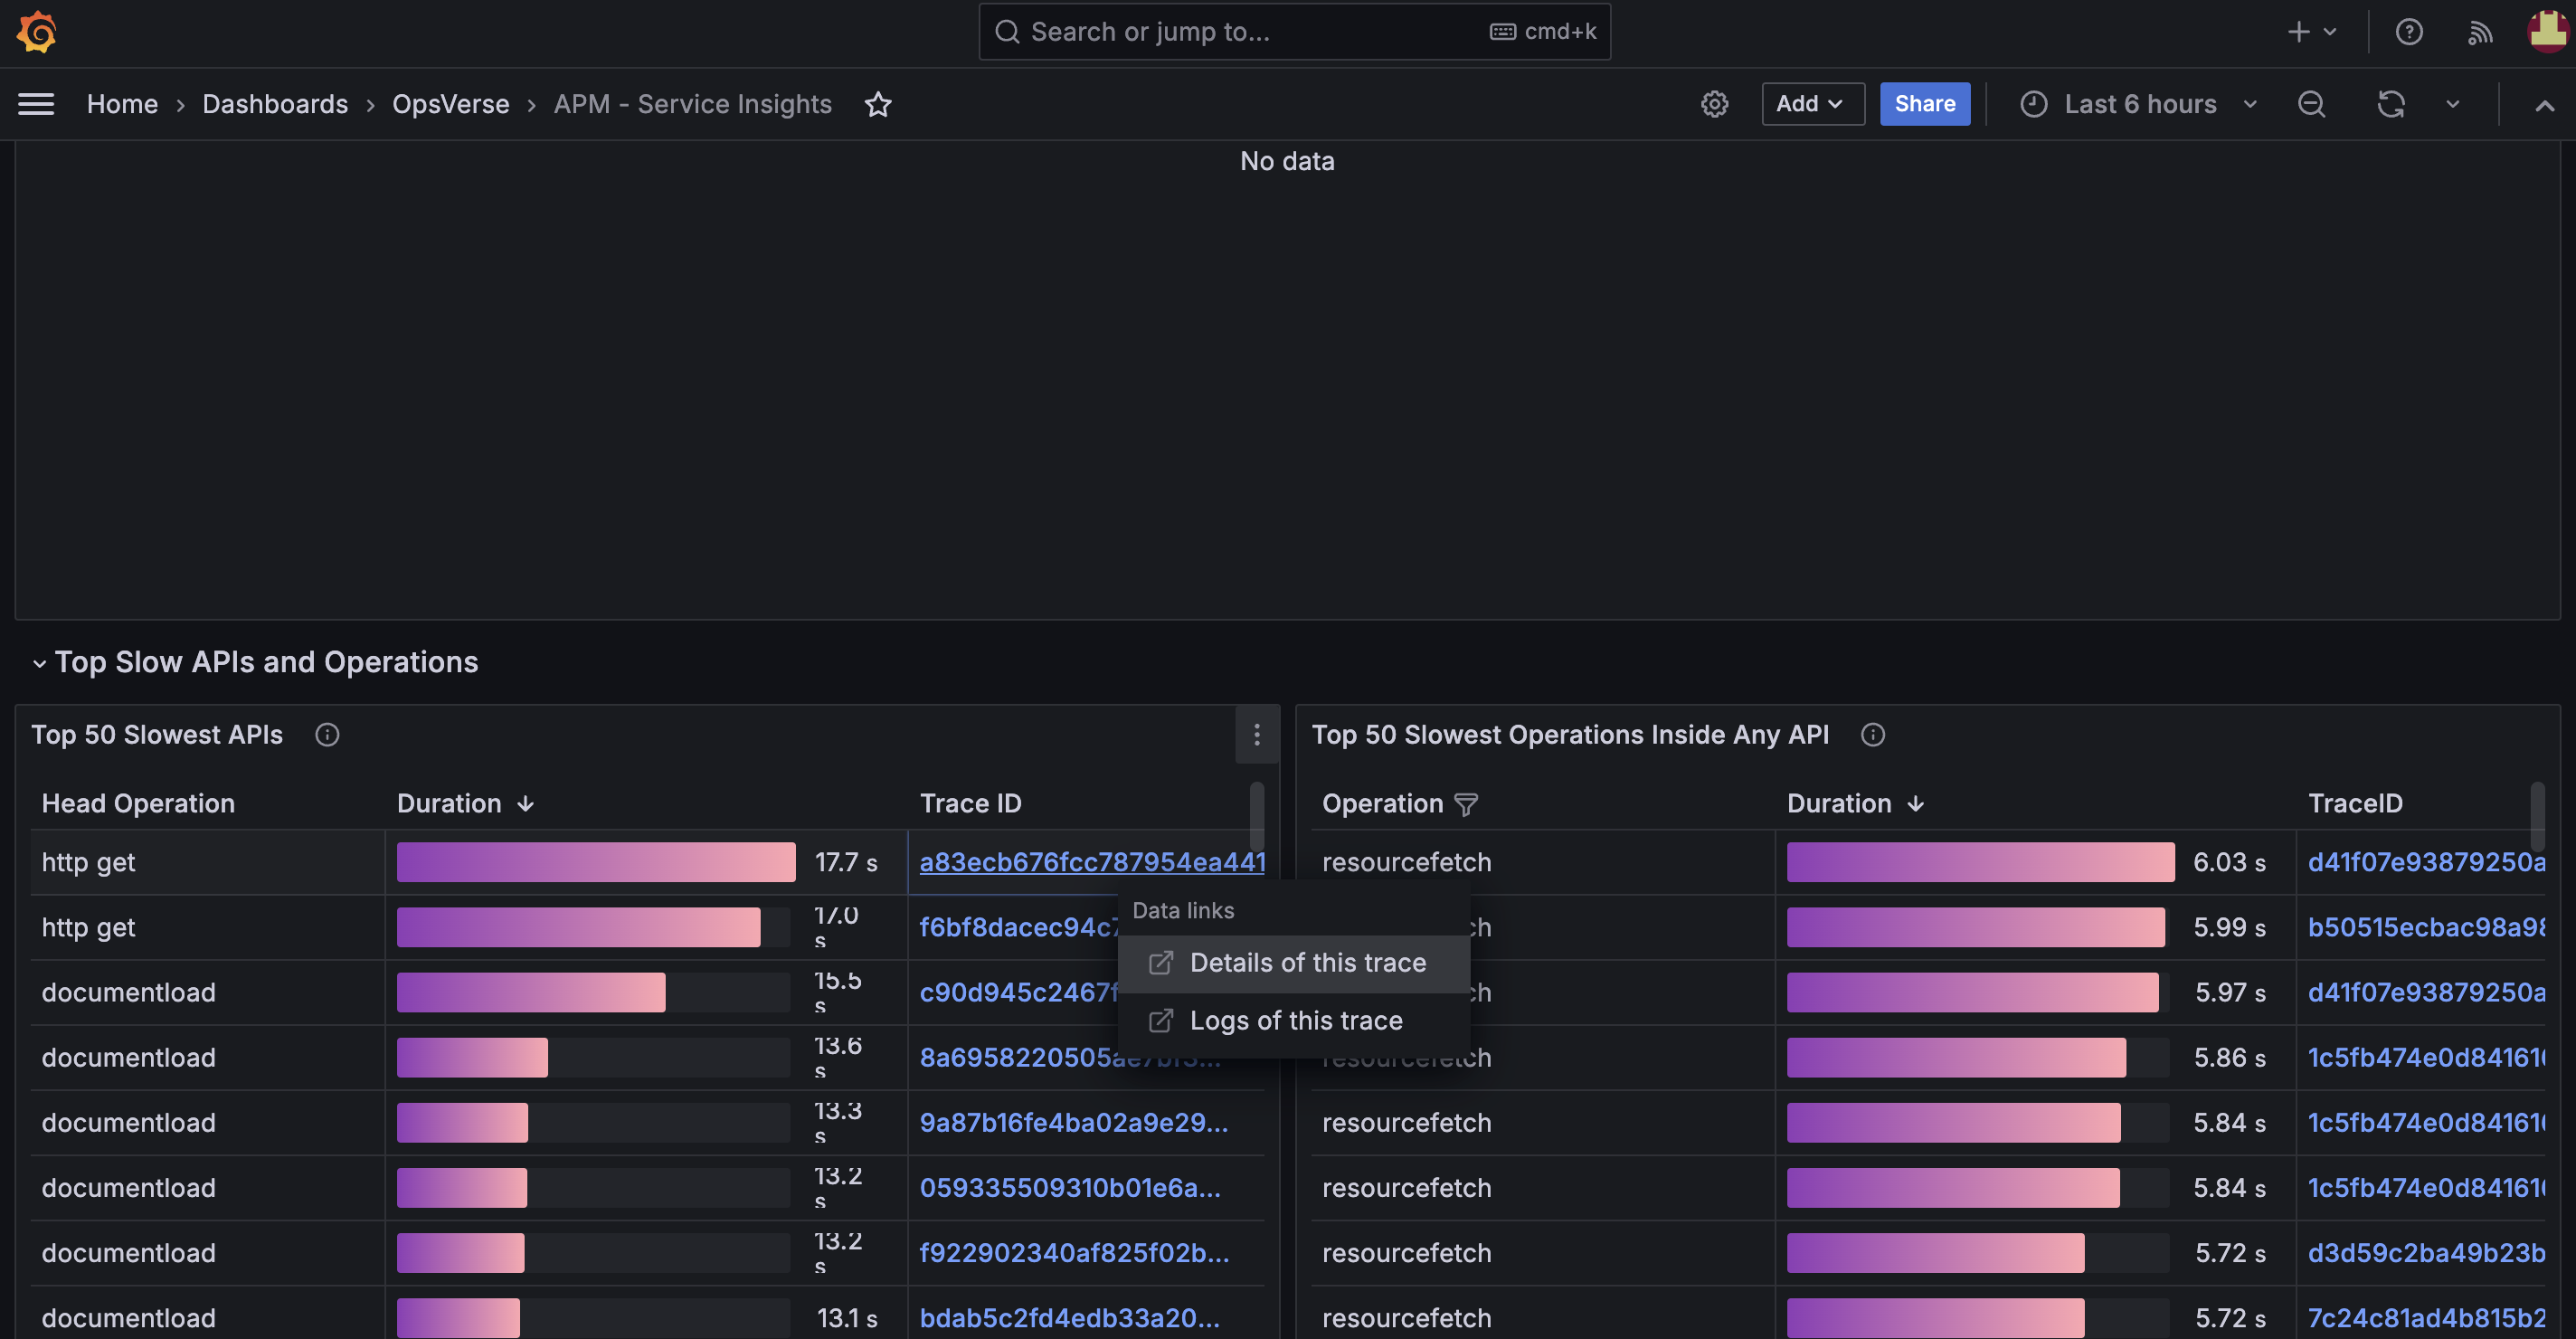
2. Select a particular Trace and click on “Details of this trace.”
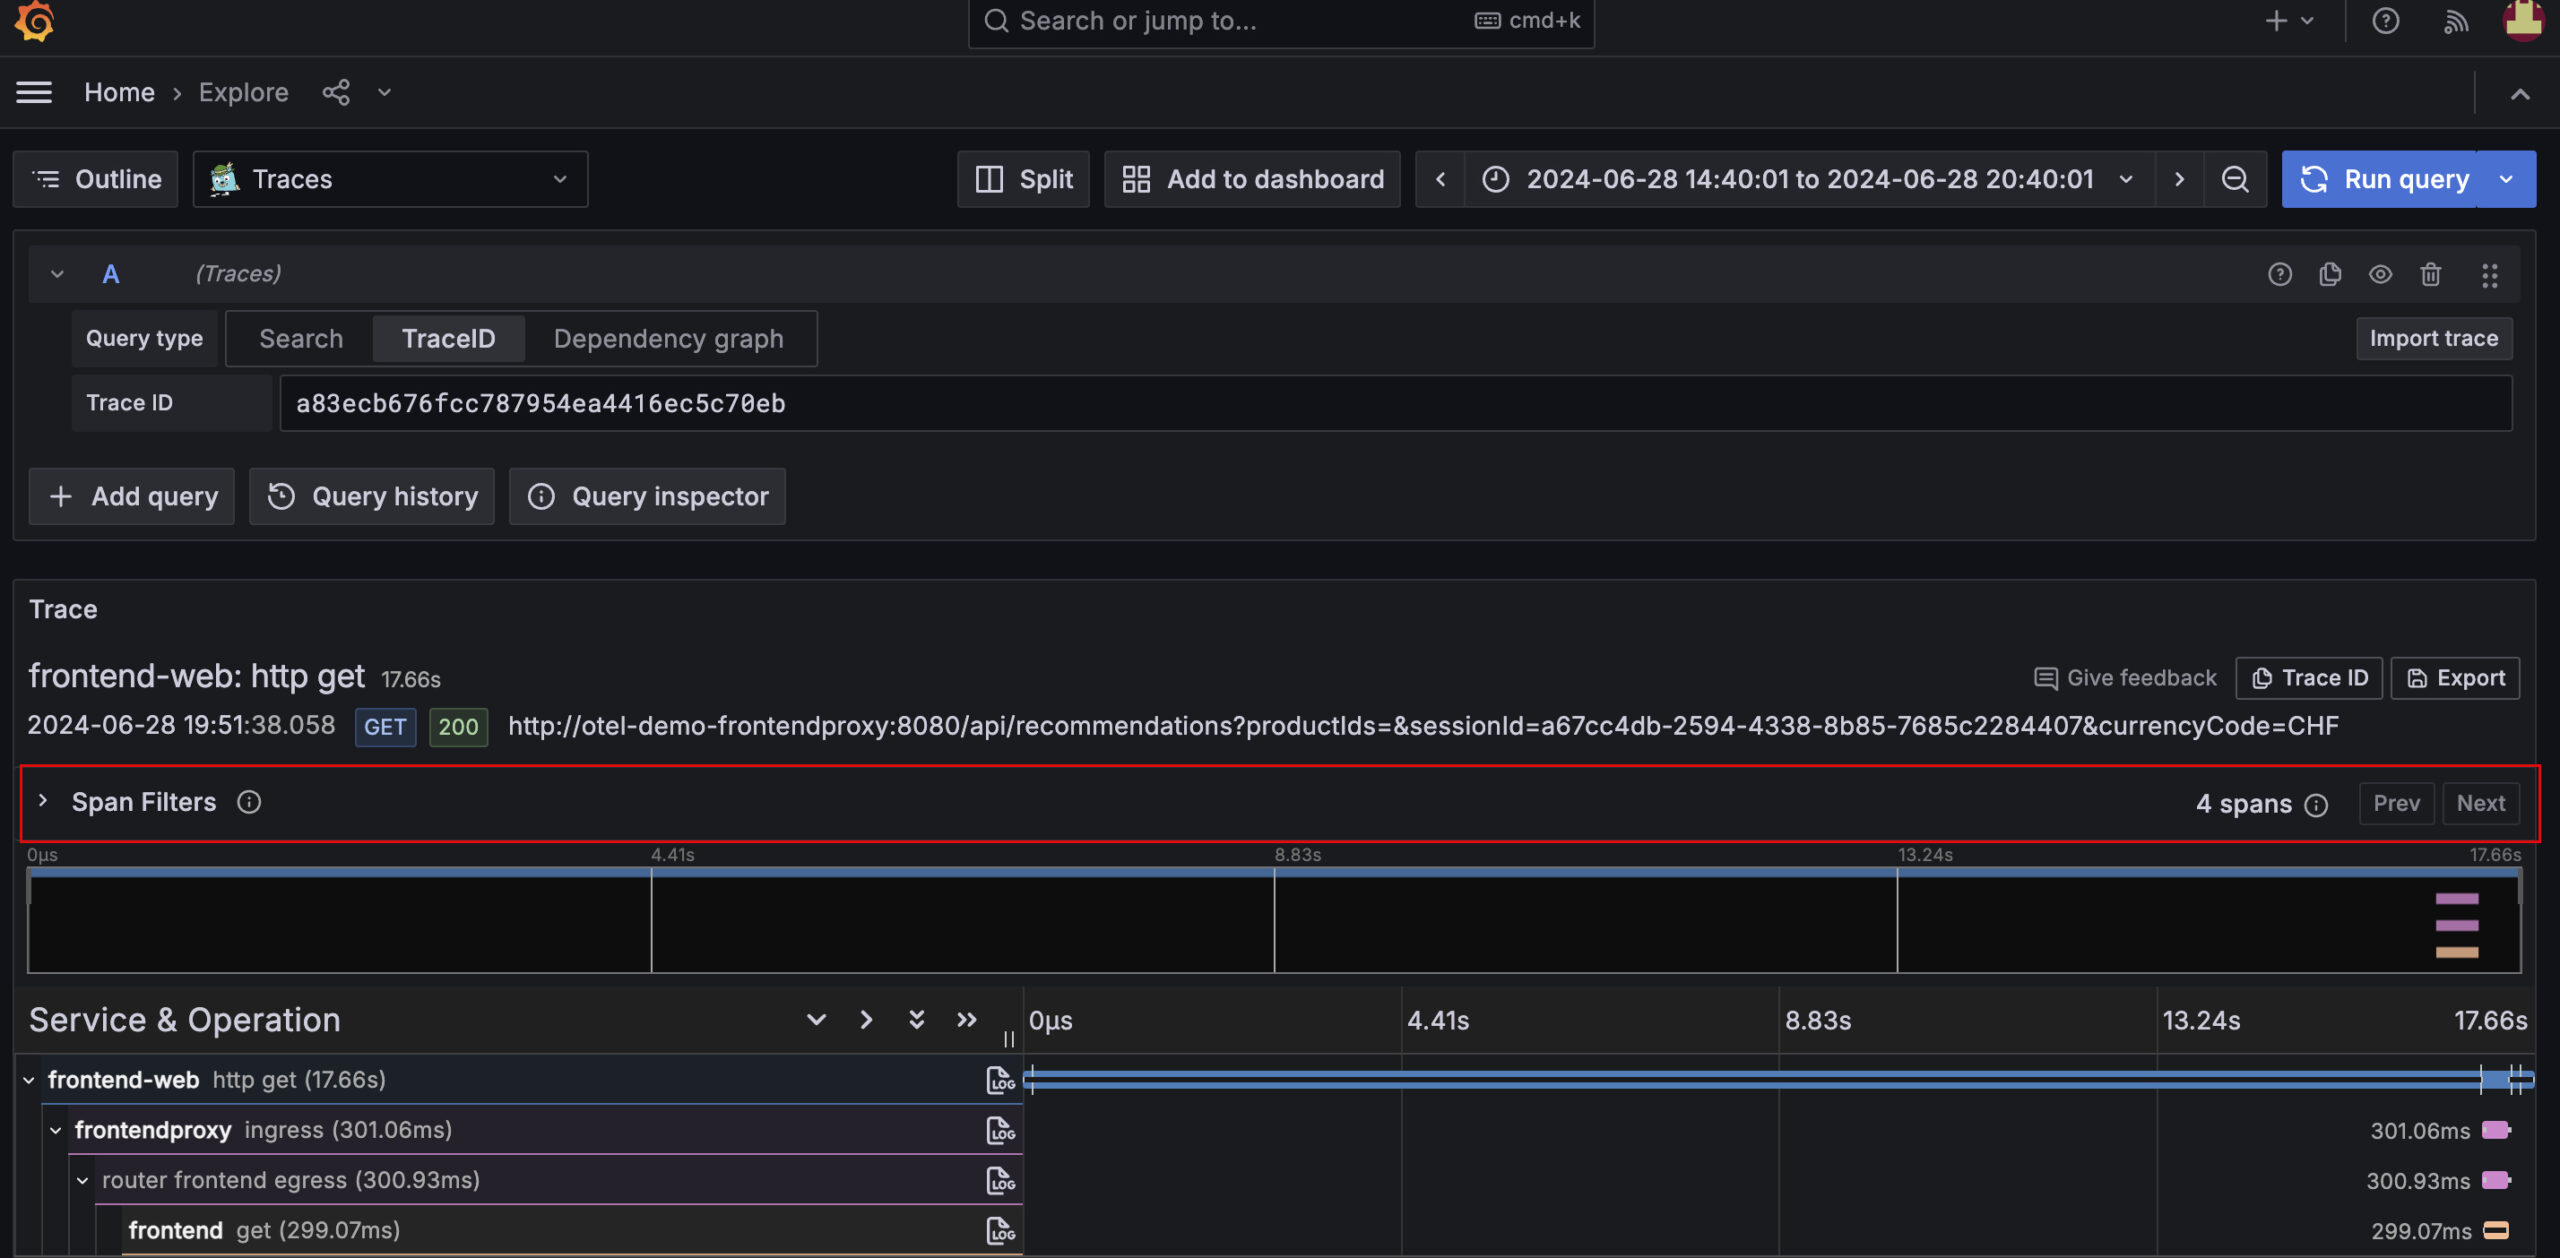
3. Click on the “Span Filters” label.
4. Use the provided filtering options to specify the criteria for the spans you’re interested in. This might include selecting spans from a particular service, with certain tags, or within a specific time range.
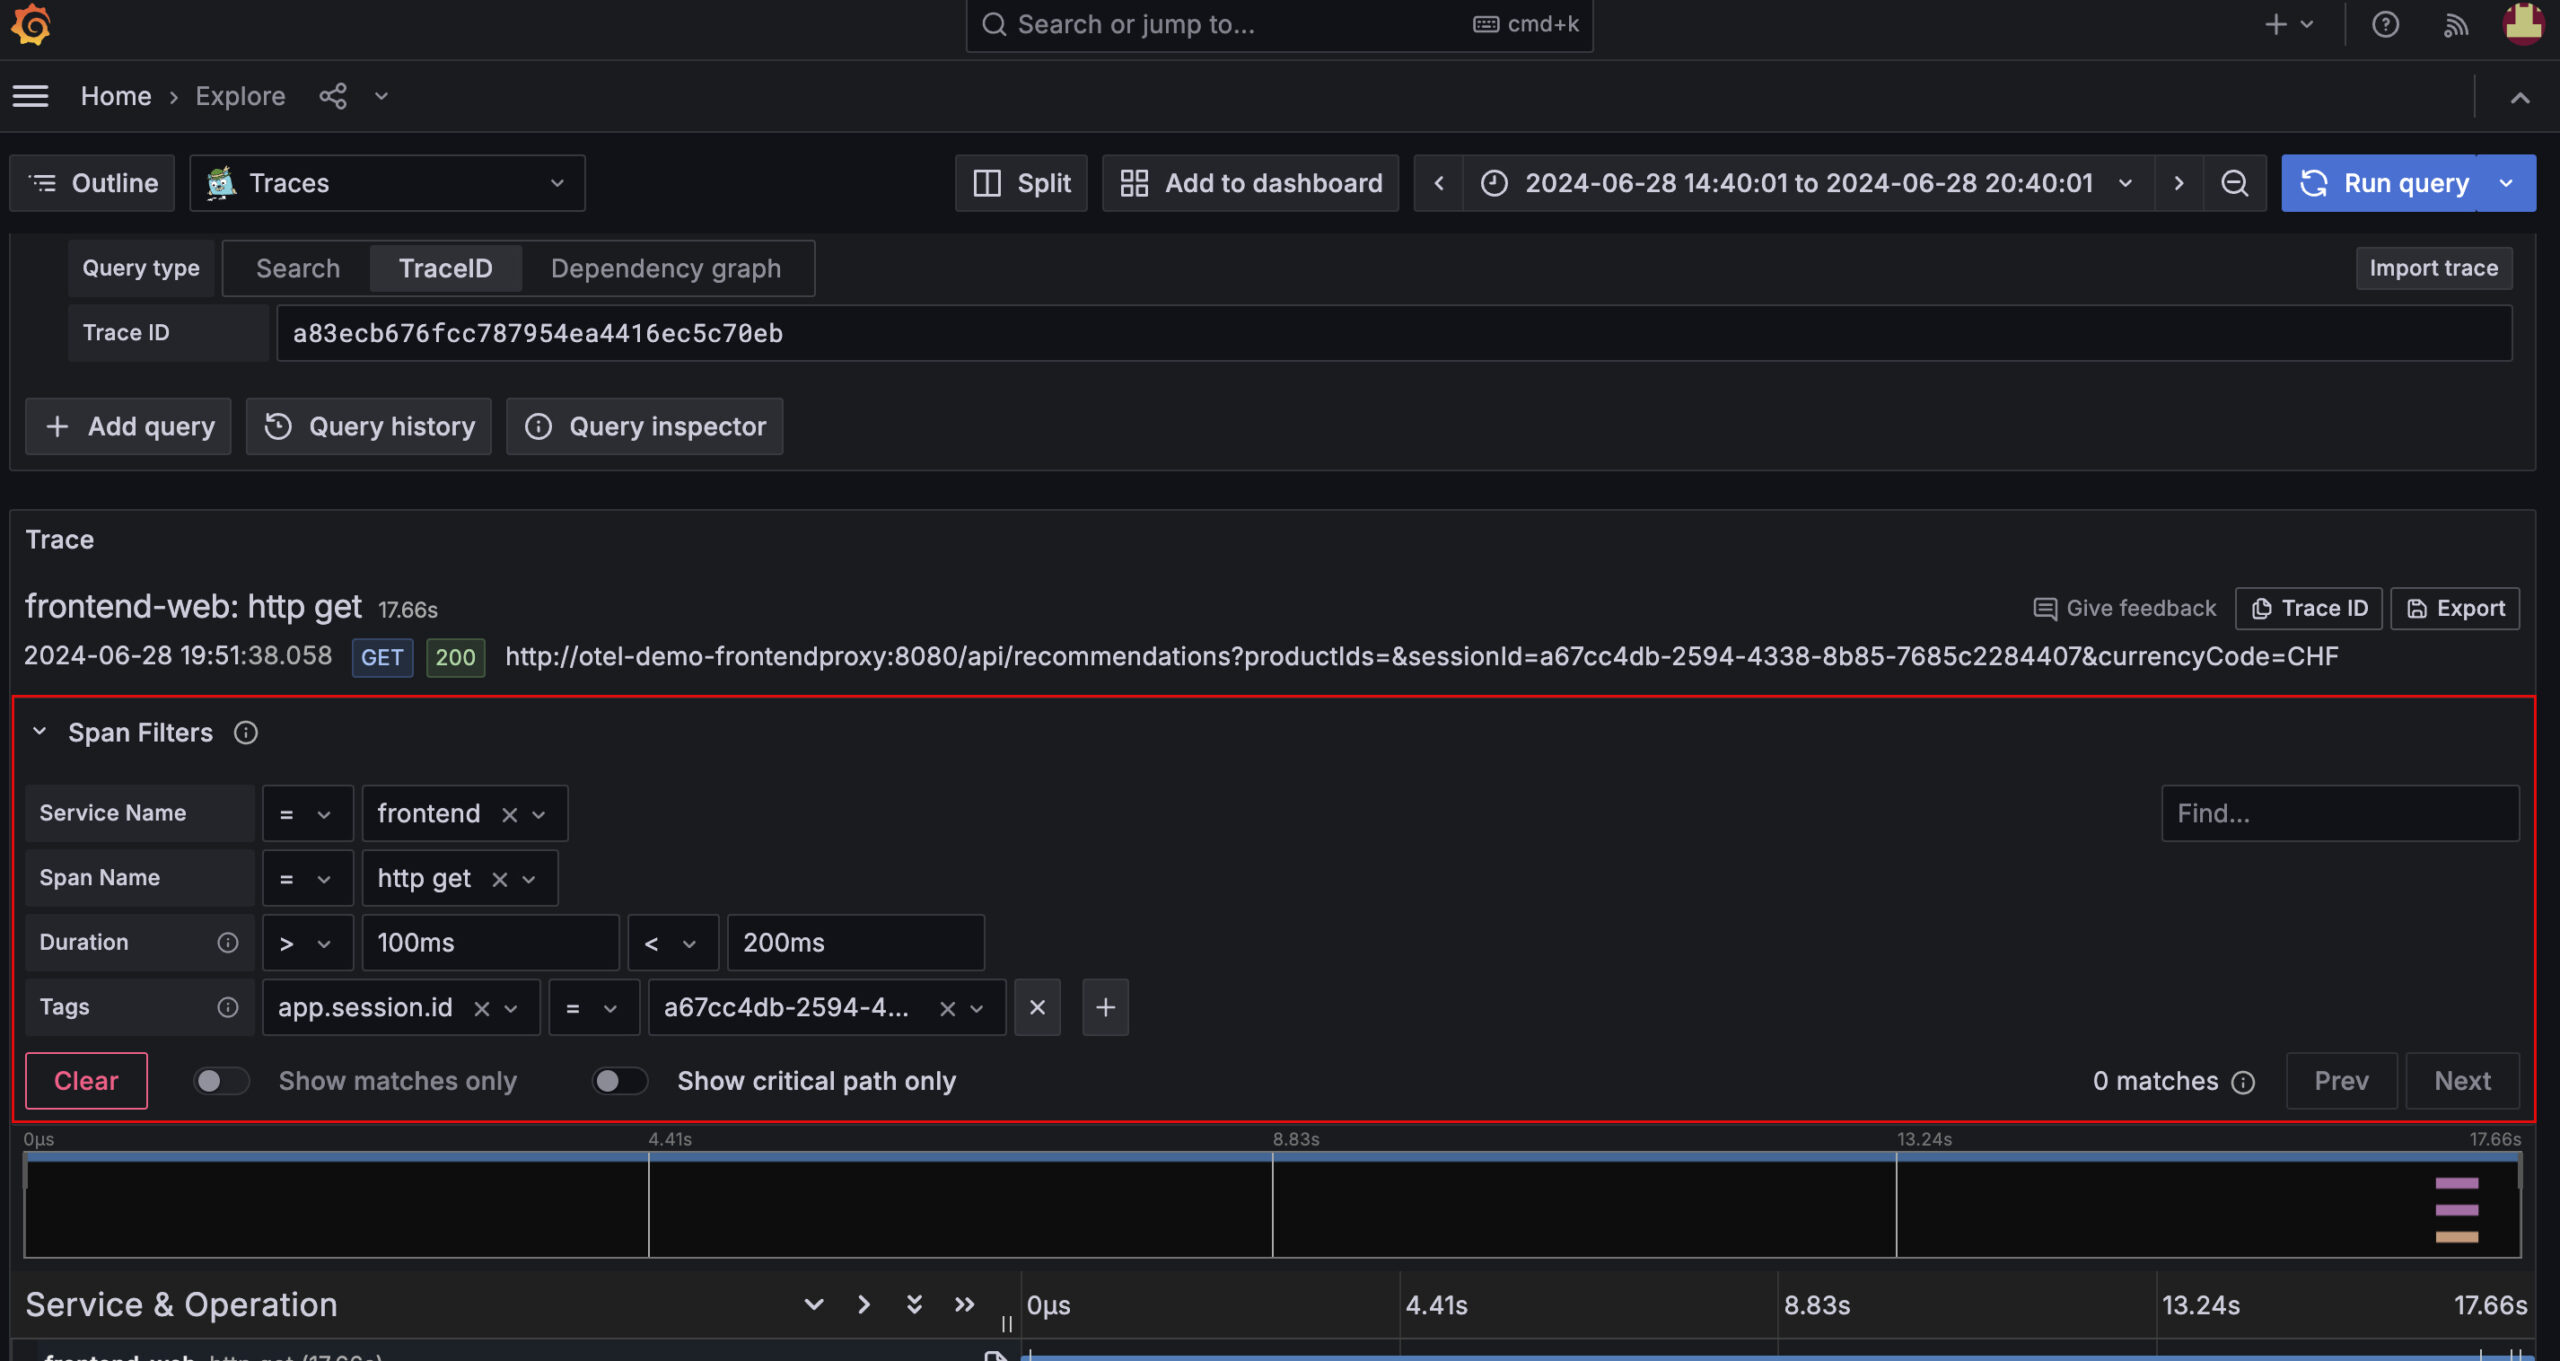
5. Once the filters are applied, click on “Run query.” Grafana will then display relevant spans only, allowing users to focus their analysis. This can be particularly useful in high-traffic systems where traces contain thousands of spans.
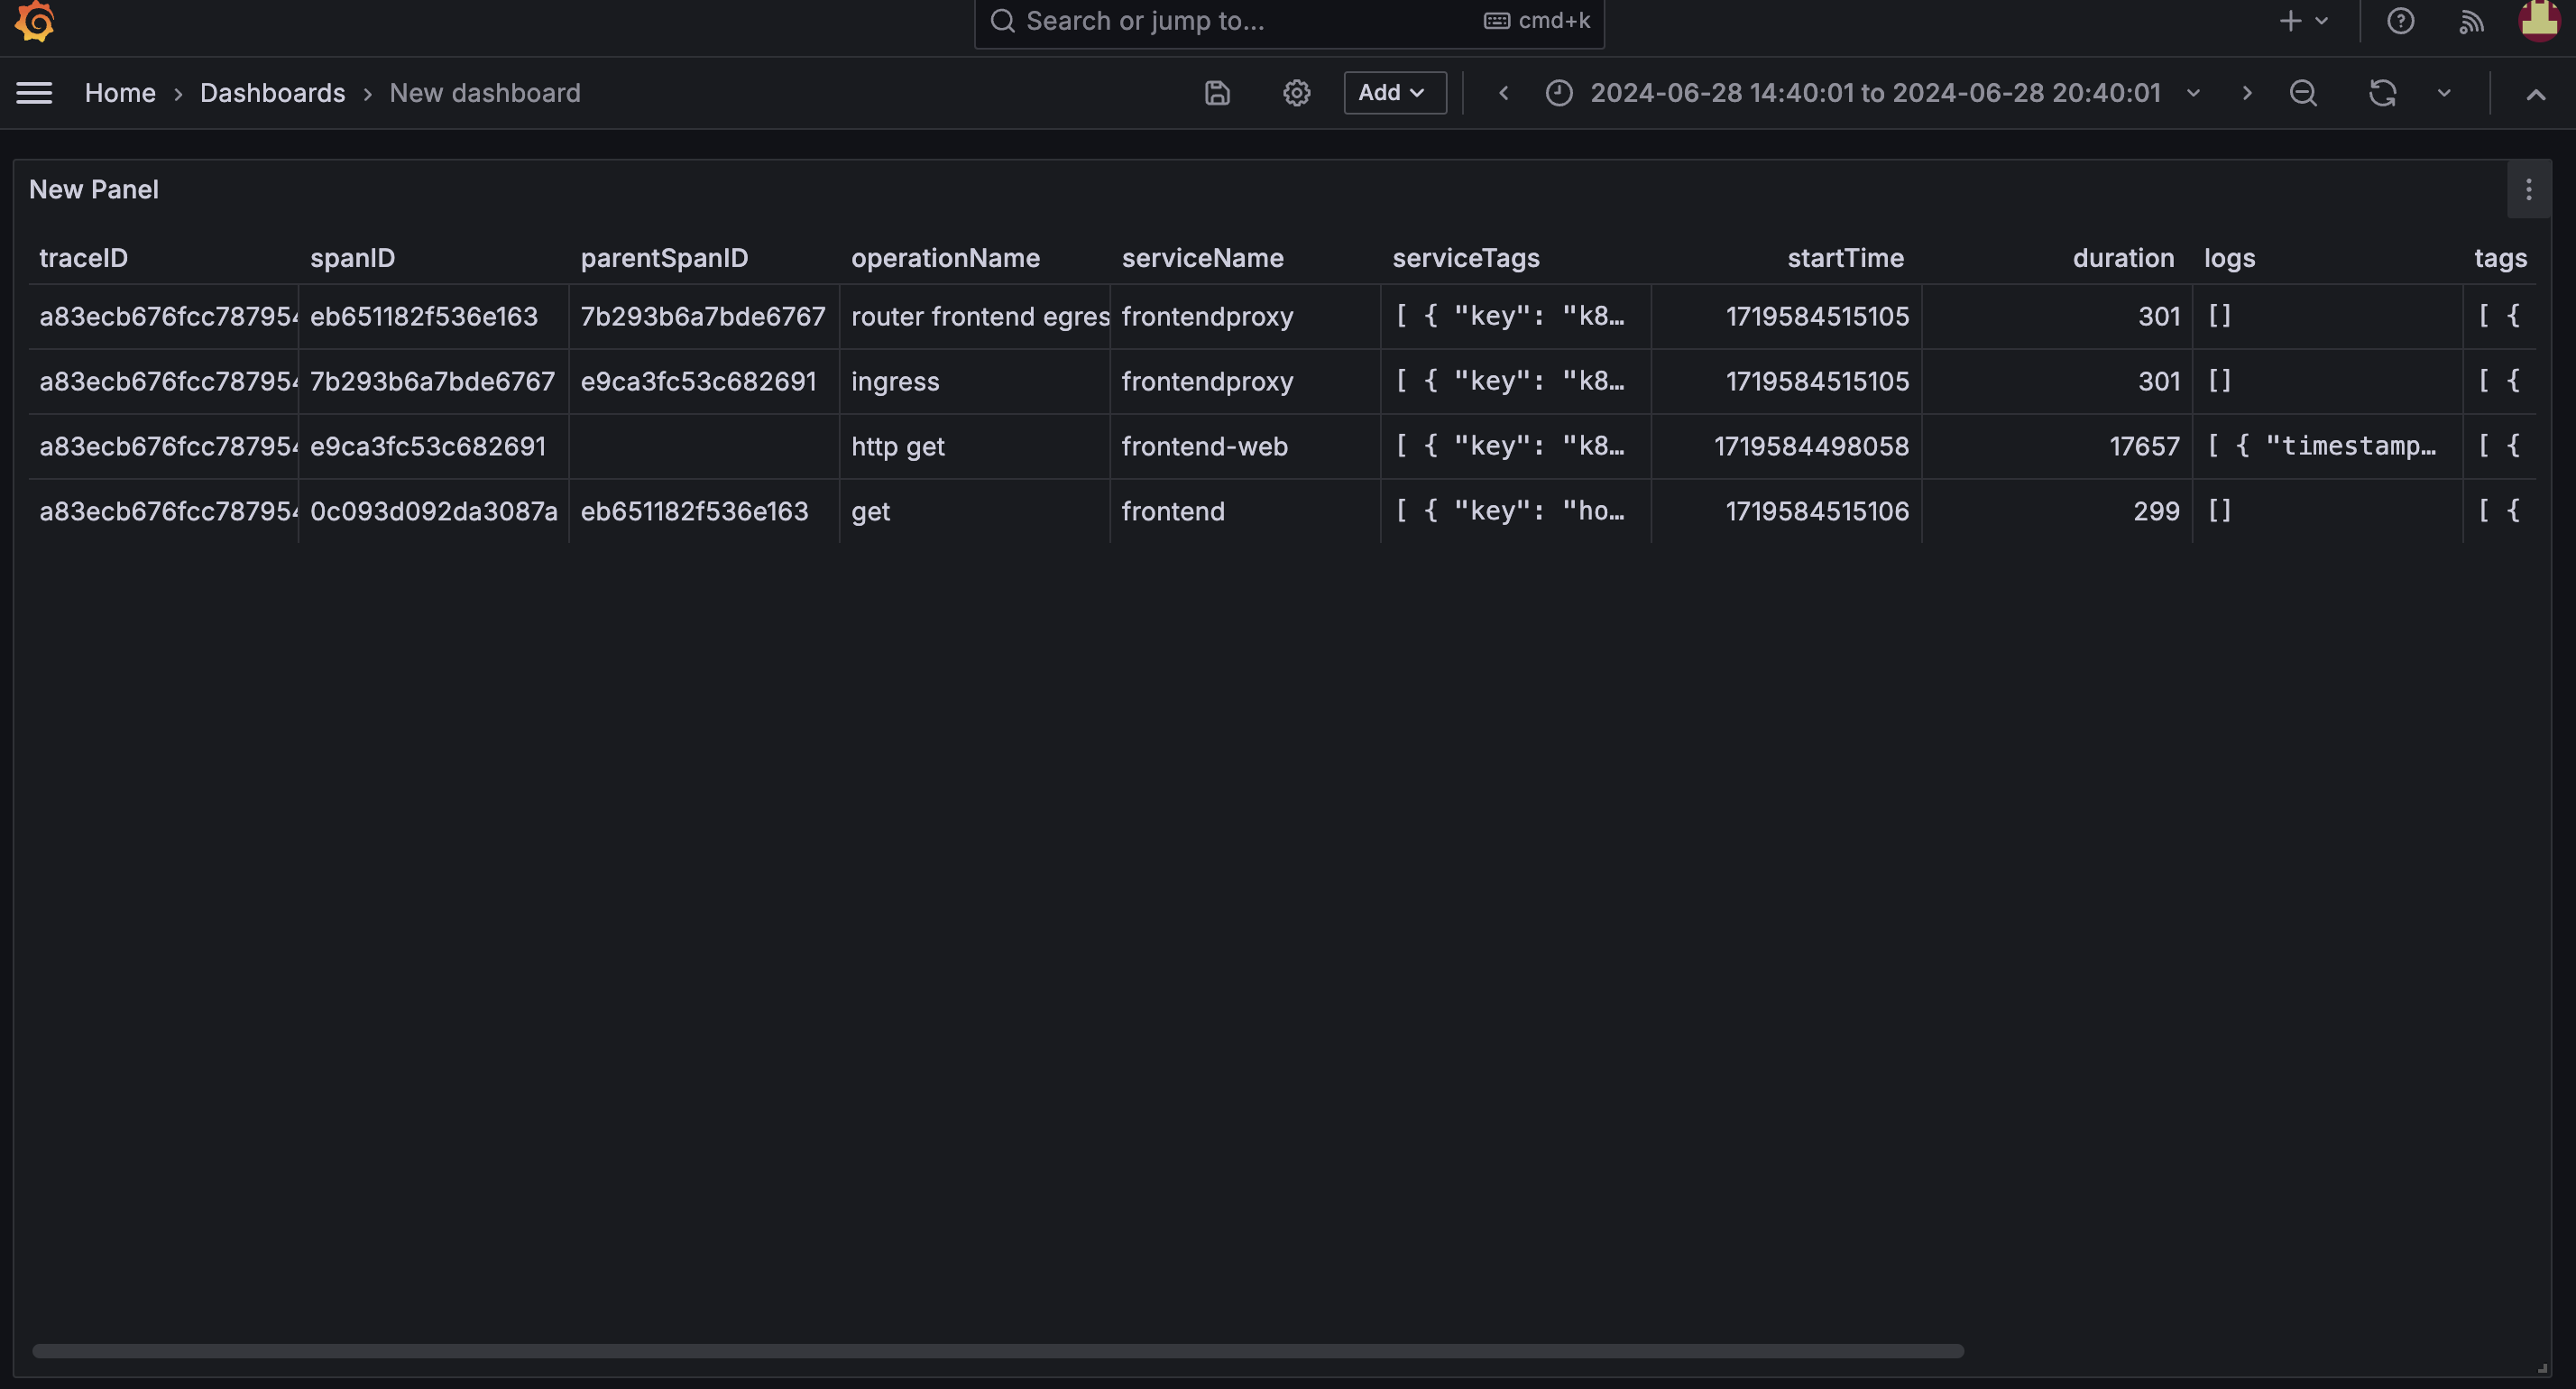
6. Create dashboards and panels that visualize the filtered spans, providing ongoing insights and proactive monitoring.
Conclusion
The introduction of Span Filtering in Grafana 10.4 significantly enhances the observability capabilities of ObserveNow. By letting users filter and analyze specific spans within a trace, ObserveNow becomes an even more powerful tool for pinpointing issues, optimizing performance, and improving troubleshooting efficiency. The ability to focus on detailed aspects of traces ensures that developers can maintain the health and performance of their distributed systems with greater ease.
With the upgraded observability stack, ObserveNow continues to empower teams to manage complex applications with greater precision and insights. Log in to the ObserveNow portal and explore the enhanced updates for yourself. You can also visit our website or talk to our experts to learn more about why we’re great at what we do.