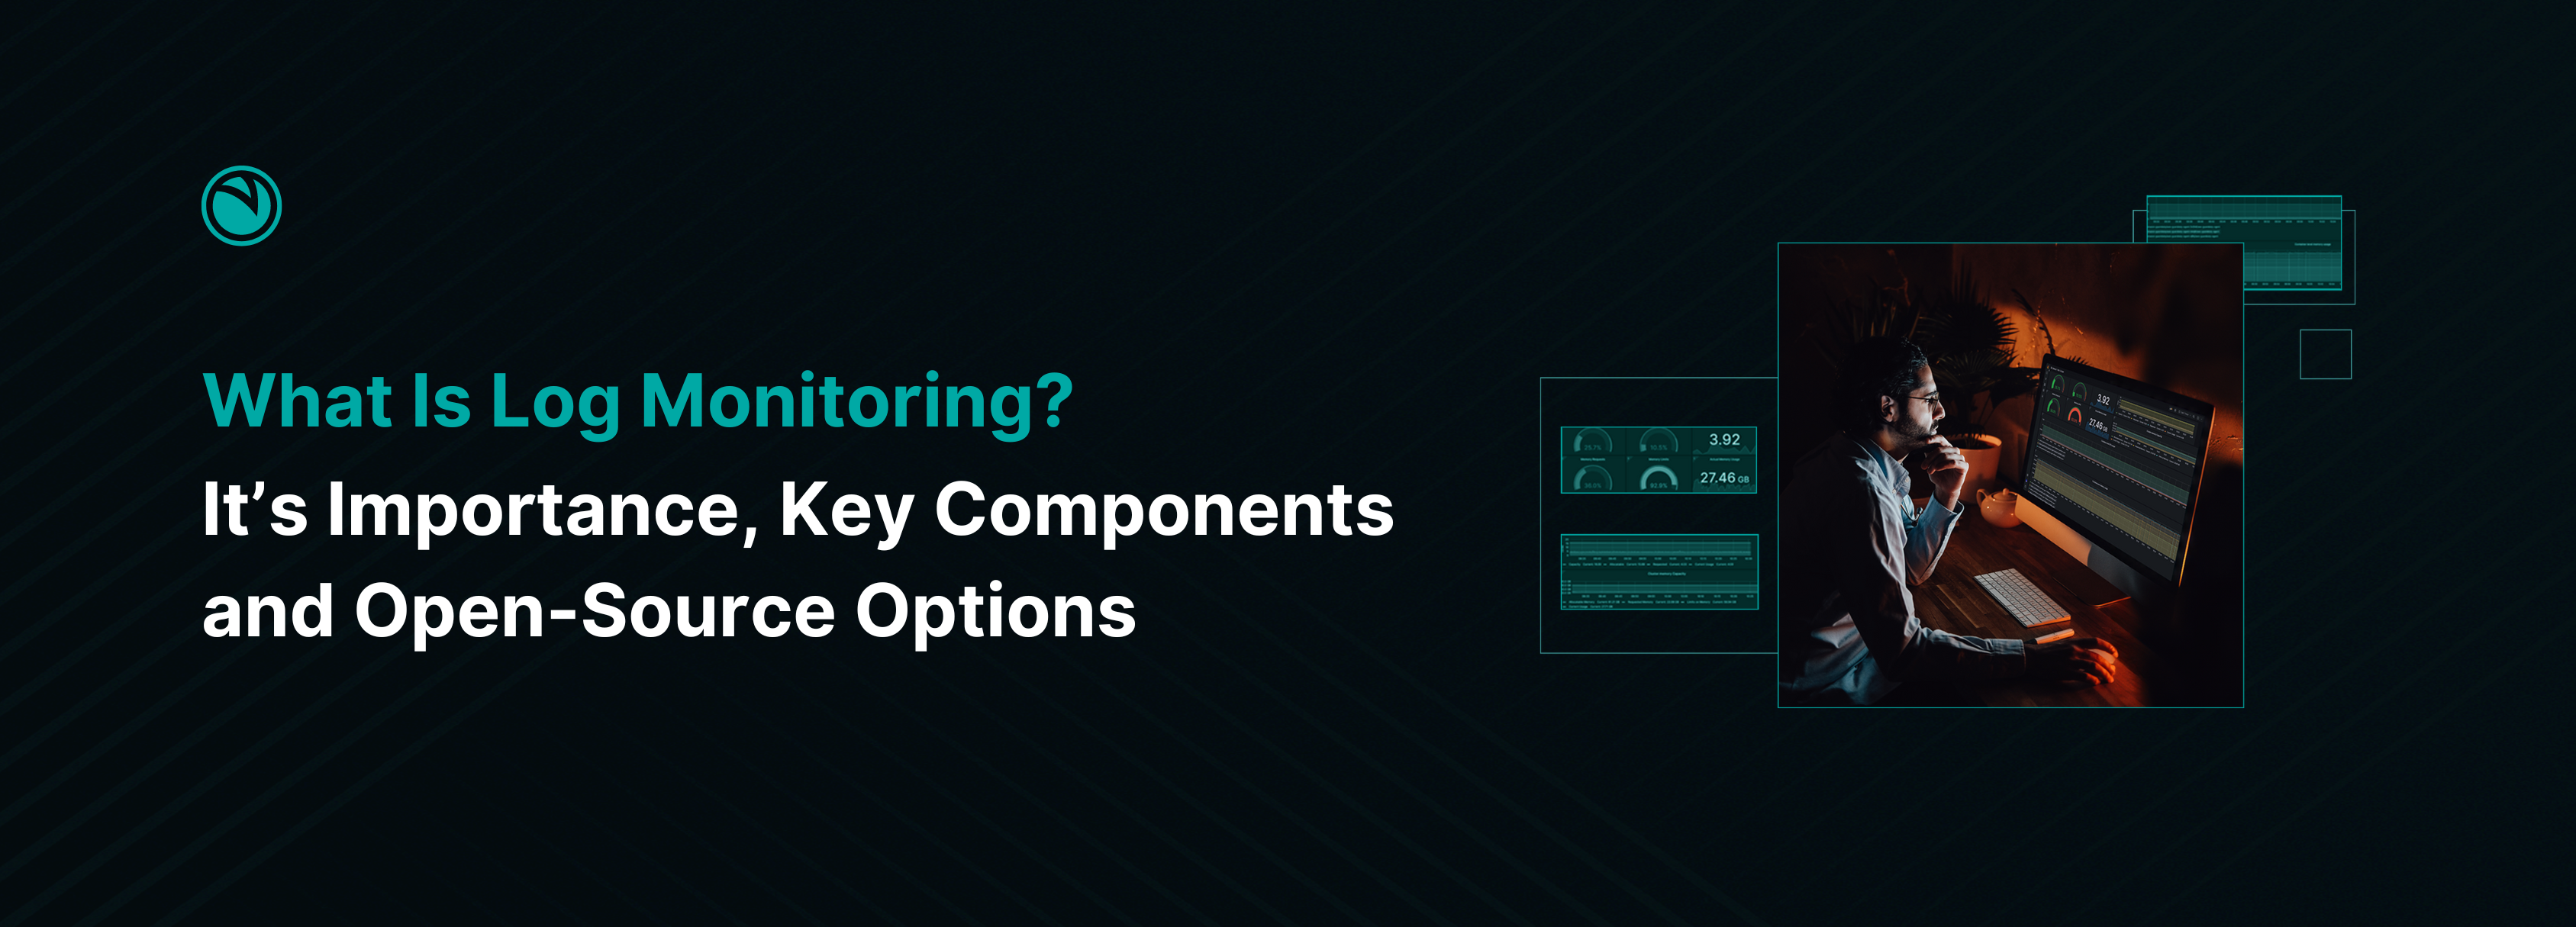
In its simplest terms, log monitoring is the process of systematically collecting, storing, analyzing, and alerting on log data generated by various systems, applications, and devices within a DevOps environment. Logs are essentially records of events, transactions, and activities that occur within these systems. They can contain valuable information about system errors, performance metrics, user activities, and security events.
The Importance of Log Monitoring
Log monitoring is incredibly important for businesses; it’s a goldmine of information that helps teams proactively identify and resolve application performance issues, ensuring critical business operations remain smooth and uninterrupted.
For example, imagine an ecommerce website experiencing a checkout failure. Through log monitoring, the IT/DevOps team identifies the issue: a misconfigured database query that has been causing the timeout and failed transactions. The team promptly resolves the issue, preventing revenue loss while keeping customers happy.
Log monitoring also helps facilitate enhanced security, enabling real-time detection and investigation of security incidents like unauthorized access attempts, malware infections, and other malicious activities.
As another example, consider a financial institution that provides its own online banking application. One fine day, customers are reporting login errors and transaction failures en masse. The IT/DevOps team quickly analyzes logs and identifies unusual traffic patterns and malicious IP addresses, indicating a DDOS attack targeting the bank’s online services. The team immediately implements countermeasures, such as traffic filtering, to block malicious addresses, rate limiting to control incoming traffic, and leveraging additional protective measures to mitigate the attack. This way, log monitoring facilitates the initial steps towards rapid detection and response to a security incident, safeguarding the financial institution and its operational integrity.
Another benefit of log monitoring is that it helps organizations meet regulatory compliance and audit requirements by providing a comprehensive record of relevant activities and events, thereby avoiding potential legal and financial repercussions.
For instance, a financial company is required to comply with the Payment Card Industry Data Security Standard (PCI DSS), which mandates strict security controls and login requirements. Through log monitoring, the company can maintain a comprehensive and centralized record of all activities related to cardholder data access, transactions, and security events. During an audit, the company can leverage these logs to demonstrate its compliance with PCI DSS requirements (by providing evidence of secure handling of cardholder data, for example).
Key Components of Log Monitoring
Understanding the key components of log monitoring is essential for implementing an effective log monitoring strategy tailored to the organization’s needs. The latter can provide a structured approach to systematically collect, store, and analyze log data from various internal sources. This structured approach efficiently and safely captures relevant log data while ensuring it’s ready for analysis and interpretation.
Log Collection
The first step is collecting log data from various sources such as servers, applications, databases, and network devices. This can be done using agents, syslog servers, or log shippers that forward log data to a centralized logging platform.
- Agent-based collection: This method involves installing lightweight software agents such as Filebeat, Fluentd or Logagent on individual servers, applications, or devices to collect and forward log data to a centralized logging platform. Agent-based collection offers real-time data collection and is particularly useful for capturing detailed, system-level logs.
- Syslog servers: Syslog is a standard protocol used for sending log messages within a network. Syslog servers act as central repositories where log data from various sources is forwarded and stored. This method is widely used for collecting logs from network devices, firewalls, and other infrastructure components.
- API-based collection: Some applications and cloud services offer Application Programming Interfaces (APIs) that allow for programmatic access to log data. API-based collection methods can be used to collect logs from cloud-based applications, SaaS platforms, and other third-party services.
Log Storage
Log storage involves securely retaining and organizing the collected log data for future analysis, reporting, and compliance purposes. Proper log storage lets organizations efficiently access, search, and retrieve historical log data when needed. This enables them to gain valuable insights, identify trends, and investigate security incidents or performance issues.
- On-premises storage: Traditional on-premises log storage solutions store log data on local servers or storage appliances within the organization’s data center. This approach offers complete control over data security and compliance, but may require significant upfront investment in hardware and maintenance.
- Cloud storage: Cloud-based log storage solutions are scalable and cost-effective storage options for organizations looking to leverage the flexibility and scalability of cloud computing. Organizations can store large volumes of log data without the need for upfront hardware investments. They also feature built-in redundancy and data protection features.
- Distributed storage systems: Distributed storage systems, such as Elasticsearch or Hadoop HDFS, are designed to handle large volumes of unstructured data. This makes them well-suited for storing and analyzing log data. These systems distribute data across multiple nodes to ensure high availability, fault tolerance, and scalability.
Alerting and Notifications
Alerting and notifications are two major components of log monitoring and play a crucial role in ensuring the timely detection and response to critical events, anomalies, or issues identified through log analysis.
A few key features of effective alerting and notification systems include customizable alert rules, multi-channel notifications, and escalation policies. Here’s a closer look at each:
- Customizable alert rules: Effective alerting systems allow teams to define and customize alert rules based on specific criteria, thresholds, or patterns identified during log analysis. This enables stakeholders to prioritize alerts based on their severity, impact, or relevance.
- Multi-channel notifications: Modern alerting systems support multi-channel notifications, including email, SMS, and voice calls, in addition to integrations with collaboration tools and incident management platforms like Slack, Microsoft Teams, and PagerDuty. The goal is to ensure that alerts reach the right individuals or teams through their preferred communication channels.
- Escalation policies: Alerting systems must support flexible escalation policies so that critical alerts can be escalated to specialized teams if they are not acknowledged or addressed within predefined timeframes. This ensures that no critical alerts are overlooked or ignored, thereby maintaining the integrity and effectiveness of the alerting process.
Popular Open-Source Log Collection and Log Monitoring Tools
There are several open-source log monitoring tools available in the market that offer robust features and functionalities. The hard part is finding which one works best for you. Some popular options today include:
- ELK Stack (Elasticsearch, Logstash, Kibana): Elasticsearch, Logstash, and Kibana is a powerful trio of tools that enables seamless log management. Elasticsearch uses a distributed, real-time search and analytics engine to store and index log data. Logstash is responsible for collecting, parsing, and forwarding logs to Elasticsearch. Kibana is a visualization tool that analyzes and visualizes log data stored in Elasticsearch. Collectively, all three projects form a comprehensive solution for log management, storage, analysis, and visualization.
- OpenTelemetry: While OpenTelemetry isn’t necessarily a log management tool, it is an open-source tool for collecting, processing, and exporting Telemetry data, including logs.
- Grafana Loki: Grafana Loki is a log aggregation system designed to store and query logs from all applications and infrastructure. With its scalable and efficient design, Loki simplifies log management by centralizing log data – making it easy for organizations to monitor, analyze, and troubleshoot issues across multiple applications.
- Apache Flume: Flume collects, aggregates, and moves large amounts of log data from various sources to a centralized data store such as the Hadoop HDFS or Apache Kafka. Flume helps build complex data pipelines by connecting multiple sources, channels, and sinks together.
- Fluentd: Fluentd is another open-source data collector that also processes and distributes log data in real-time. With Fluentd, you can handle data from different sources and forward it to multiple destinations with ease.
While understanding the key components of log monitoring and leveraging the right tools can go a long way towards implementing a successful strategy, there are several best practices that organizations should consider to optimize their initiatives further. These best practices include defining clear objectives, establishing baseline metrics, implementing log retention policies, and regularly reviewing and updating their log monitoring strategies to adapt to changing business requirements.
Stay tuned for part 2 of our blog series where we’ll dive even deeper into these best practices for effective log monitoring. We’ll also provide actionable insights, tips, and recommendations that can help organizations build a resilient, scalable, and compliant log monitoring infrastructure. Meanwhile, you can always check out our other other blog posts here.

