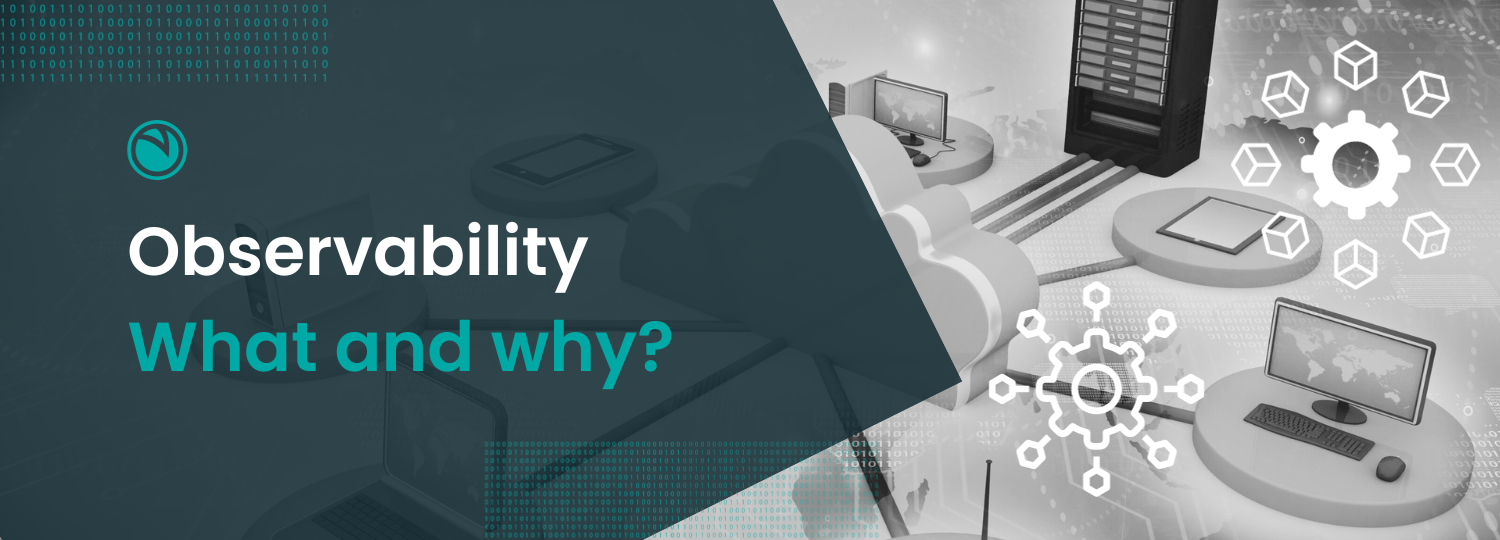
To meet this demand, the concept of observability has emerged as a critical practice. Observability isn’t merely a trendy term, it’s a fundamental aspect of modern software development and operations. In this blog, we will explore what observability means in the context of DevOps and delve into the various pillars that form its foundation.
What Does Observability Mean?
As defined by Hungarian-American engineer Rudolf E. Kálmán, observability is “a measure of how well the internal states of a system can be inferred from knowledge of its external outputs.” For the past two decades, engineers had relied on individual tools to monitor applications, networks and infrastructure. Many application performance monitoring (APM) tools aggregated data that was used to mitigate application issues. While APM tools worked well for monolithic applications (or applications architected in a traditional way), the traditional tools haven’t been very useful with the rise of microservices, containers and serverless functions.
Today application components are deployed, managed and modified independently. With microservices being adopted widely, developers write smaller pieces of independent code that is deployed multiple times a day to production. This makes it difficult for teams to track and monitor outages and traditional monitoring tools haven’t kept up with the pace.
When a production issue arises, Engineering teams need to identify the source of the issue at the shortest possible time. To do this, they need to look into logs, metrics, events and traces in a correlated fashion. The traditional way of using just the logs, metrics and alerting do not help any more. Responding to issues before it affects customers is the key.
Here’s where observability comes in.
Observability goes beyond traditional monitoring, focusing on understanding the “why” behind system behavior, not just the “what.”
The Three Pillars of Observability – Or Is It Four?
Many DevOps engineers are familiar with the three pillars of observability – logs, metrics and traces. But at OpsVerse, we believe that there are four pillars or four data types that observability relies on – metrics, events, logs and distributed traces (in short called as MELT).
Metrics: In observability, metrics are measurements gathered and monitored over a period of time. They provide real-time data on critical indicators like CPU usage, memory consumption, response times, and error rates. Metrics are essential for monitoring the health of a system and detecting anomalies or performance bottlenecks.
Events:Events are discrete occurrences or actions within a system. They represent specific points in time when something important happens, such as a user login, an API request, or an error occurrence.
Logs: Logs are detailed records of system activities and events. They often contain a chronological sequence of messages or entries generated by various components of the system. Logs can include informational messages, warnings, errors, and debugging output. log is a text line that describes an event that happened at a certain time.
Distributed Traces: In a microservices application, you can have thousands of services calling one another. Distributed tracing helps you understand how these services are connected and how the data flows through them. It allows you to identify latency issues, bottlenecks, and dependencies between services. Tracing is especially valuable in microservices architectures and complex distributed systems.
Observability only works when the information from these four pillars is transformed into real insights. One pillar doesn’t work without the other.
Why is Observability the Key for DevOps?
As mentioned earlier, observability plays a critical role in DevOps practices, as it contributes to several key aspects of modern software development and operations.
Here are some of the crucial reasons why observability is important in DevOps practices:
Early Detection of Issues: Observability tools provide real-time insights into the performance and behavior of software systems. This early detection of issues allows DevOps teams to identify and address problems before they impact users or escalate into major incidents. This proactive approach helps maintain system reliability and availability.
Faster Troubleshooting: When issues do arise, observability enables rapid troubleshooting. With access to comprehensive logs, metrics, traces, and events, teams can pinpoint the root causes of problems more quickly. This reduces mean time to resolution (MTTR) and minimizes downtime, enhancing the overall user experience.
Improved Collaboration: DevOps practices emphasize collaboration between development and operations teams. Observability tools provide a common set of data and insights that both teams can use to understand system behavior. This shared understanding fosters better communication, cooperation, and joint problem-solving.
Enhanced Release Management: Observability tools can help evaluate the impact of new releases or updates on system performance and stability. By monitoring the behavior of the system before, during, and after a release, DevOps teams can make informed decisions and ensure smooth deployments.
Security and Compliance: Observability is essential for security monitoring and compliance. It enables the detection of security threats, anomalies, and unauthorized activities within the system. DevOps teams can respond promptly to security incidents and ensure compliance with industry regulations.
Feedback Loops: Observability tools facilitate the creation of feedback loops in the development process. Continuous feedback from monitoring and observability can drive iterative improvements in both code quality and system architecture, aligning with the DevOps principle of continuous improvement.
What are Observability Tools?
Many organizations start their observability journey by adopting individual tools that are specialized in monitoring specific aspects of their systems. For example, they might use one tool for metrics (e.g., Prometheus), another for events (e.g., Kafka), a different one for logs (e.g., ELK Stack), and distributed tracing tools (e.g., Jaeger or Zipkin). Each of these tools excels in its specific area but may lack integration with others.
While using specialized tools for specific aspects of observability can provide valuable insights into those areas, it can lead to a fragmented and siloed approach to observability.
And as mentioned earlier, observability only works when all the four pillars are transformed into insights and the fragmentation caused by using multiple tools can lead to:
Complexity in observing applications: Managing multiple tools with different interfaces and configurations can be complex and time-consuming.
Limited context for solving issues: When issues arise, it can be challenging to correlate data from different tools to understand the root cause comprehensively.
Reduced operational efficiency: Teams may spend more time managing these tools than addressing actual issues, reducing operational efficiency.
To fully harness the benefits of observability and address these challenges, organizations should prioritize the use of integrated Observability tools that encompass all four pillars of observability: metrics, events, logs, and distributed tracing. This holistic approach enables organizations to effectively navigate the complexities of dynamic software ecosystems.
Stay tuned as we further explore the evolving landscape of observability tools in our upcoming blog, uncovering how they can empower organizations to stay on top of DevOps practices.

