As a company built on top of open source observability tools and in collaboration with the thriving OSS community, we’re always on the lookout for new, interesting projects that we can leverage, sponsor, and contribute to. And in recent months, a project that we’ve been tracking closely is Odigos.
Odigos is an open-source observability control plane that aims to automatically instrument applications within K8s clusters without code changes, and manage the deployment and scaling of collectors according to application traffic. This eliminates the need for manual deployment and configuration of collectors. It’s been remarkable to see the project grow quickly from it’s humble roots into a much more full-fledged auto-instrumentation platform, leveraging other battle-tested OSS tooling like eBPF and OpenTelemetry.
And in the spirit of OSS, we’re happy to contribute the OpsVerse destination to Odigos, to allow developers to auto-instrument their clusters with Odigos (≥ v0.1.38), and analyze their logs, metrics, and traces on the OpsVerse ObserveNow platform!
Tutorial
Prerequisites:A K8s cluster to instrument, credentials for an OpsVerse ObserveNow stack, Helm CLI for installing helm charts
1. Install Odigos using the official helm chart
2. Set up AutoInstrumentation:
Visit localhost:3000 in a browser. This should open up the setup page that allows you to configure target services to auto-instrument. Choose the services you want to instrument or just pick “Opt out” and let Odigos pick up all services for auto-instrumentation.
3. Configure OpsVerse as a destination:
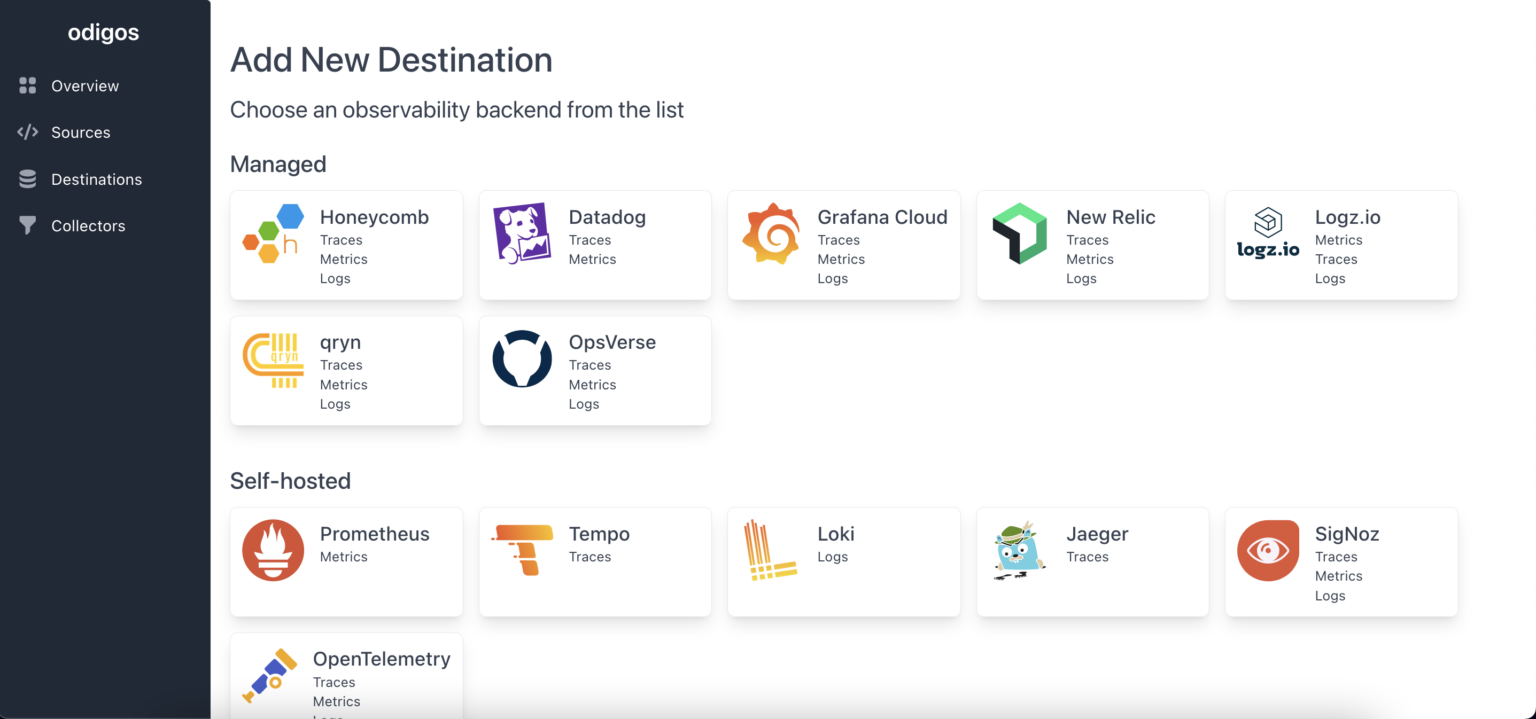
On the destinations page, pick OpsVerse as a destination and fill in the following information:
- Traces URL: https://traces-your-stack.opsverse.cloud
- Metrics URL: https://metrics-your-stack.opsverse.cloud
- Logs URL: https://logs-your-stack.opsverse.cloud
- Username: OpsVerse stack username
- Password: OpsVerse stack password
Click “done” and voila! You’ve just auto-instrumented your stack. Odigos internally will auto-instrument your services using eBPF and/or OpenTelemetry and gather service logs, traces, and metrics which will be available in your ObserveNow stack instantly!
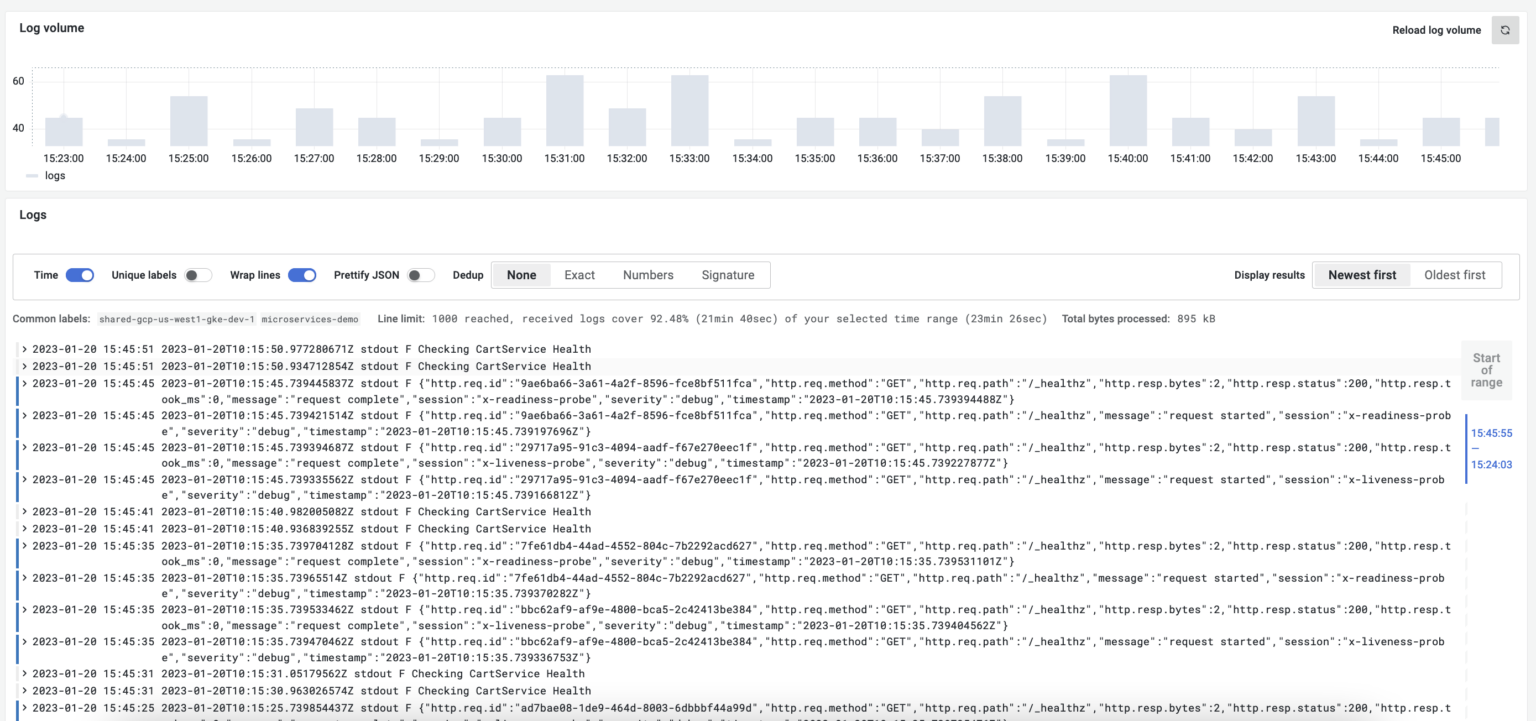
Just like that, without writing a single line of code, we’ve successfully instrumented a K8s cluster with Odigos + OpsVerse and can now explore logs, metrics, and traces from your cluster with absolute ease!

Cloud-native observability projects like Odigos allow dev teams to auto-instrumentat capabilities very easily. Kudos to keyval for maintaining this useful project and hope they continue to grow by leaps and bounds!
OpsVerse ObserveNow is a managed, battle-tested, scalable observability platform built on top of open source software and open standards. ObserveNow can be deployed as a cloud service or as a private SaaS installation within your own cloud (AWS/GCS/Azure). If you’d like to explore OpsVerse ObserveNow, click here to start a free trial today!

