Why Enterprises Prefer Open-Source Observability Tools Over Commercial Tools
Observability has become a cornerstone for optimizing the health, performance, and reliability of complex systems...
8 Common Pitfalls to Avoid When Choosing an Observability Tool
In our previous blog, we talked about the various factors an organization must consider when selecting an...
9 Factors To Consider When Choosing an Observability Tool
In today's complex digital landscape, ensuring the reliability, performance, and security of your applications and...
OpsVerse Recognized as “Representative Vendor” by Gartner for Internal Developer Portal
We’re extremely proud to announce that OpsVerse has been recognized as a "Representative Vendor" by Gartner in the...
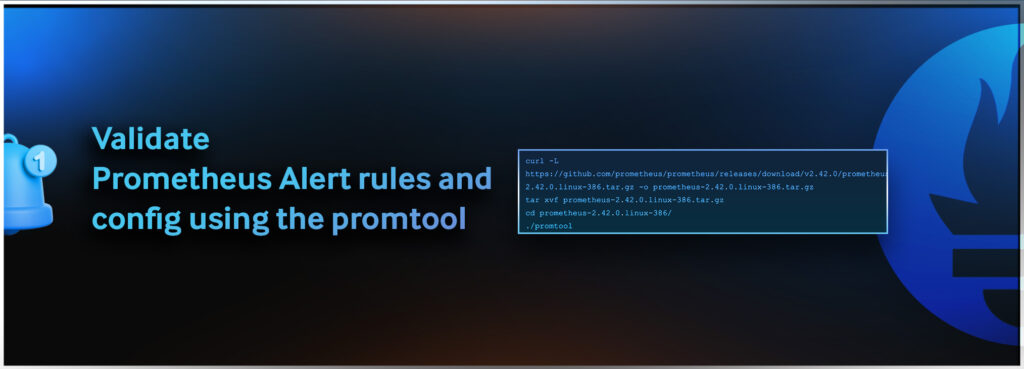
Validate Prometheus Alert rules and config using the promtool
Prometheus is a powerful, widely used open source monitoring tool. Alerting is one of the most critical features of...
What is Observability in DevOps? And Why is it Important?
Observability helps you understand the state of an application through the output of the application data. This...


