
Access logs are a rich source of information about the requests and responses served by an application server. These logs can act as valuable resources when determining key performance indicators like API visits, user session activity, error rates, and even more esoteric information like browser user-agent composition. Access logs are also among the first candidates used by developers when debugging sudden issues. In their simplest avatar, access log looks like this:
|
1 2 |
0:0:0:0:0:0:0:1 - - [10/Mar/2023:23:14:51 +0530] "GET /api/v1/endpoint HTTP/1.1" 200 27 0:0:0:0:0:0:0:1 - - [10/Mar/2023:23:14:53 +0530] "GET /api/v1/another_endpoint HTTP/1.1" 200 32 |
Spring Boot, which is among the most common frameworks used today to build Java-based applications, bundles an embedded Tomcat (or Jetty) server which collects all the application access logs like the ones shown above. These logs are saved in a log file within a pre-configured directory. Spring Boot allows for a high degree of configurability when it comes to logs. Everything from the extension of the log file to the formatting of dates can be configured as per your preference.
But having logs in a file on the server makes it hard for us to search through them on-demand. And it’s even harder when we have multiple servers running the same application code. A solution we use and recommend is to export these logs to Grafana Loki using Promtail. So let’s see how we can do that!
Loki and Promtail
Loki is an open-source log aggregation system maintained by Grafana. Loki provides a query language, LogQL, that can be used to query logs and generate dashboards. Loki is an fast, cost-effective tool for large-scale log aggregation, since it can effectively leverage object stores like Amazon S3 to store actual log chunks, while only needing to store an index in a traditional database. Data can be pushed into Loki using log collection agents like Promtail and queried visually using the Grafana UI.
Promtail is an agent that runs on each node running your application servers and ships logs to a preconfigured Grafana Loki instance. When run within a K8s cluster, it uses the Kubernetes API to discover pods running in the same node as the agent, and continuously fetches logs from these pods (hence the tail in the promtail). It looks for a __host__ label on all the target pods and compares it to its own hostname to validate the target, and ships matching logs to Loki.
Note: The fastest way to bring up a stack with Grafana, Loki and Promtail is using OpsVerse ObserveNow, which is a modern, opinionated, scalable observability stack powered by Open Source tools. Since Grafana, Loki and Promtail are already available within ObserveNow, you can simply create a new stack in a single click, and then helm install the opsverse-agent into your cluster and be up and running.
Exporting Spring Boot Access Logs to Loki
To leverage the potential of a JSON parser in LogQL, it makes sense if these logs are in a JSON structure as it makes querying the logs considerably easier. The usage of JSON logging patterns also helps with creating dashboards and alerts using LogQL. Given these requirements, let us go ahead and add the following properties in the Spring Boot application.properties file. Note that the keys in server.tomcat.accesslog.pattern can be changed to include or exclude specific log components. You can see the variables you can use here.
|
1 2 3 4 5 6 7 8 9 |
server.tomcat.accesslog.enabled=true server.tomcat.accesslog.pattern={"ip": "%h", "user": "%l", "username": "%u", "time": "%t", "request": "%r", "status":"%s", "responsesize": "%b"} server.tomcat.accesslog.directory=/dev server.tomcat.accesslog.prefix=stdout server.tomcat.accesslog.buffered=false # Don't use empty double quotes here server.tomcat.accesslog.suffix= server.tomcat.accesslog.file-date-format= |
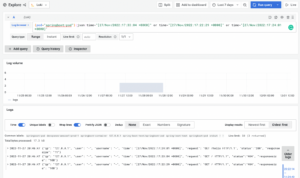
And that’s it! Once this Spring Boot application is deployed to a cluster that has promtail running on it, promtail will automatically pick up the JSON formatted logs and ship them to the preconfigured Loki instance. And once we have the logs in Loki, we can easily query logs across different application server replicas, filter logs to find specific patterns, and even set alerts triggered by logs (eg. Rate of 5xx went up in last 30 mins).
OpsVerse ObserveNow is a managed, battle-tested, scalable observability platform built on top of open source software and open standards. ObserveNow can be deployed as a cloud service or as a private SaaS installation within your own cloud (AWS/GCS/Azure). If you’d like to explore OpsVerse ObserveNow, click here to start a free trial today!


