Implementing a consistent and reliable alerting system across a sprawling organization is a significant challenge for just about any engineering team. For example, diverse infrastructures across different teams and numerous team-specific customizations may not translate well when investigating specific incidents. Inconsistent alerting practices can eventually lead to fatigue, leading to triggering of alerts that may not be relevant or actionable. These issues can even render the entire alerting system ineffective.
However, Grafana’s Provisioned Alerting feature can be an effective way to address these issues. This feature allows you to systematically manage your alerting components by providing modularity for each alerting component. It also enables the importing and exporting of custom alert rules, contact points, notification policies, mute timings, and templates across different Grafana instances. This flexibility allows large organizations to quickly set up alerting resources that are common across different teams, thereby saving time and reducing the margin of human error inherently involved in the process.
Here are three ways you can import alerting resources into your Grafana instance:
The following is an example of how you can use the alert provisioning API to create an alert rule:
- Make an API call to create an alert with the alert rule in the body. The screenshot below is an example of an Host Out of Memory (OOM) alert rule. Note that this cannot be used as is to make an API call to your respective Grafana instance as it assumes you have a folder, OpsVerse-Alerts, and a Prometheus data source with UID metrics. You may edit this JSON to match your setup.
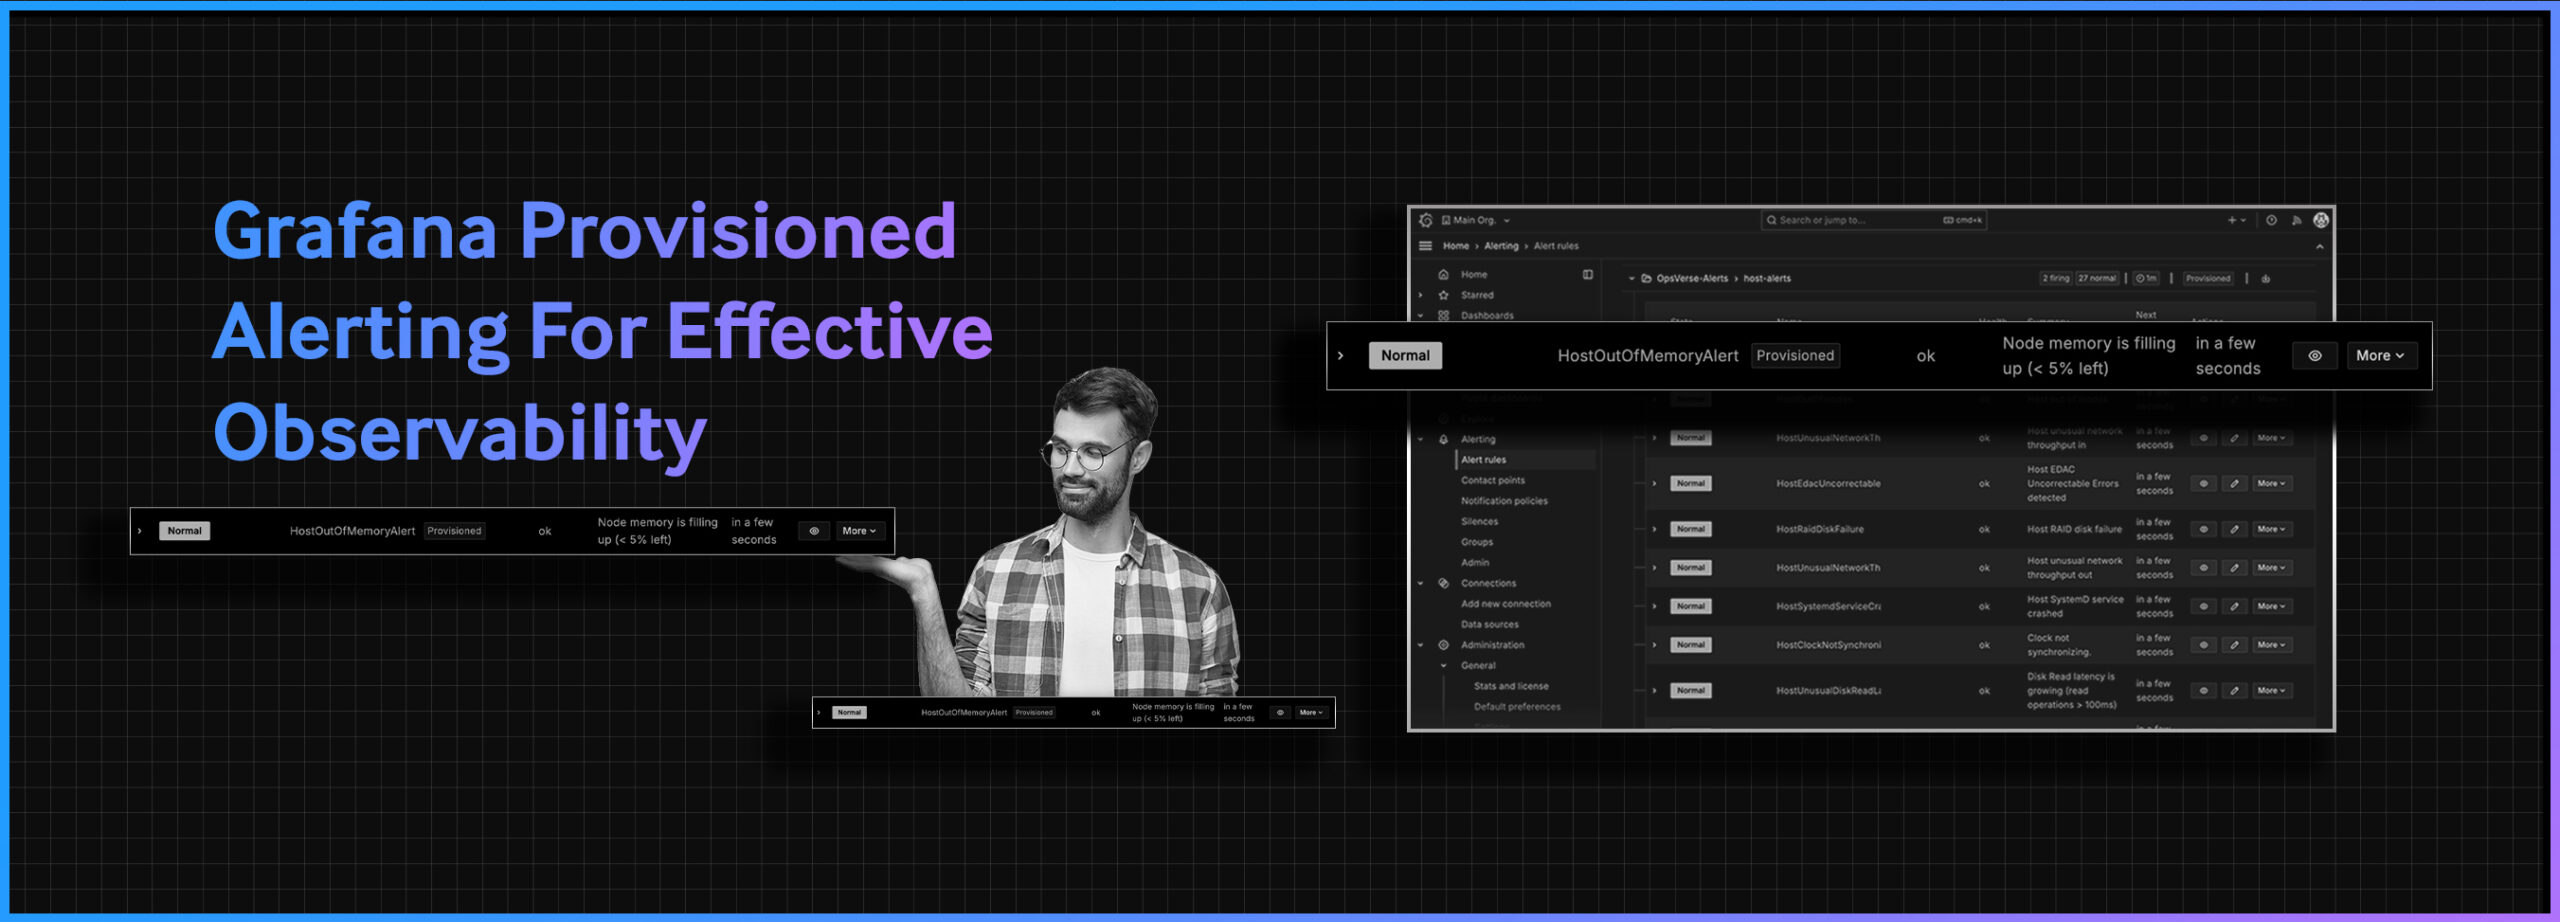
- The alert should appear on your Grafana instances with a Provisioned label, as shown here:


Alerting resources can be exported via UI as well as API. The UI exports alert resources in Terraform format. To export an alert in a provisioning file format, the Alerting HTTP API endpoints can be used.
To learn more about how to streamline your alerts and save valuable time, check out the links and detailed documentation we posted in this blog. Feel free to also contact our experts who can help take your alerting systems to the next level.

