When it comes to data visualization, Grafana reigns supreme within the developer community.
With plugins that can connect to dozens of datasources (like time-series databases such as Prometheus) and panels you can add to your dashboards, it’s not surprising to see your favorite apps already provide Grafana dashboards as a way of visualizing its current health.
It’s also unsurprising that we provide our users with a Grafana instance when they launch the open source based observability stack – for the visualization component of their metrics, logs, traces, and performance insights.
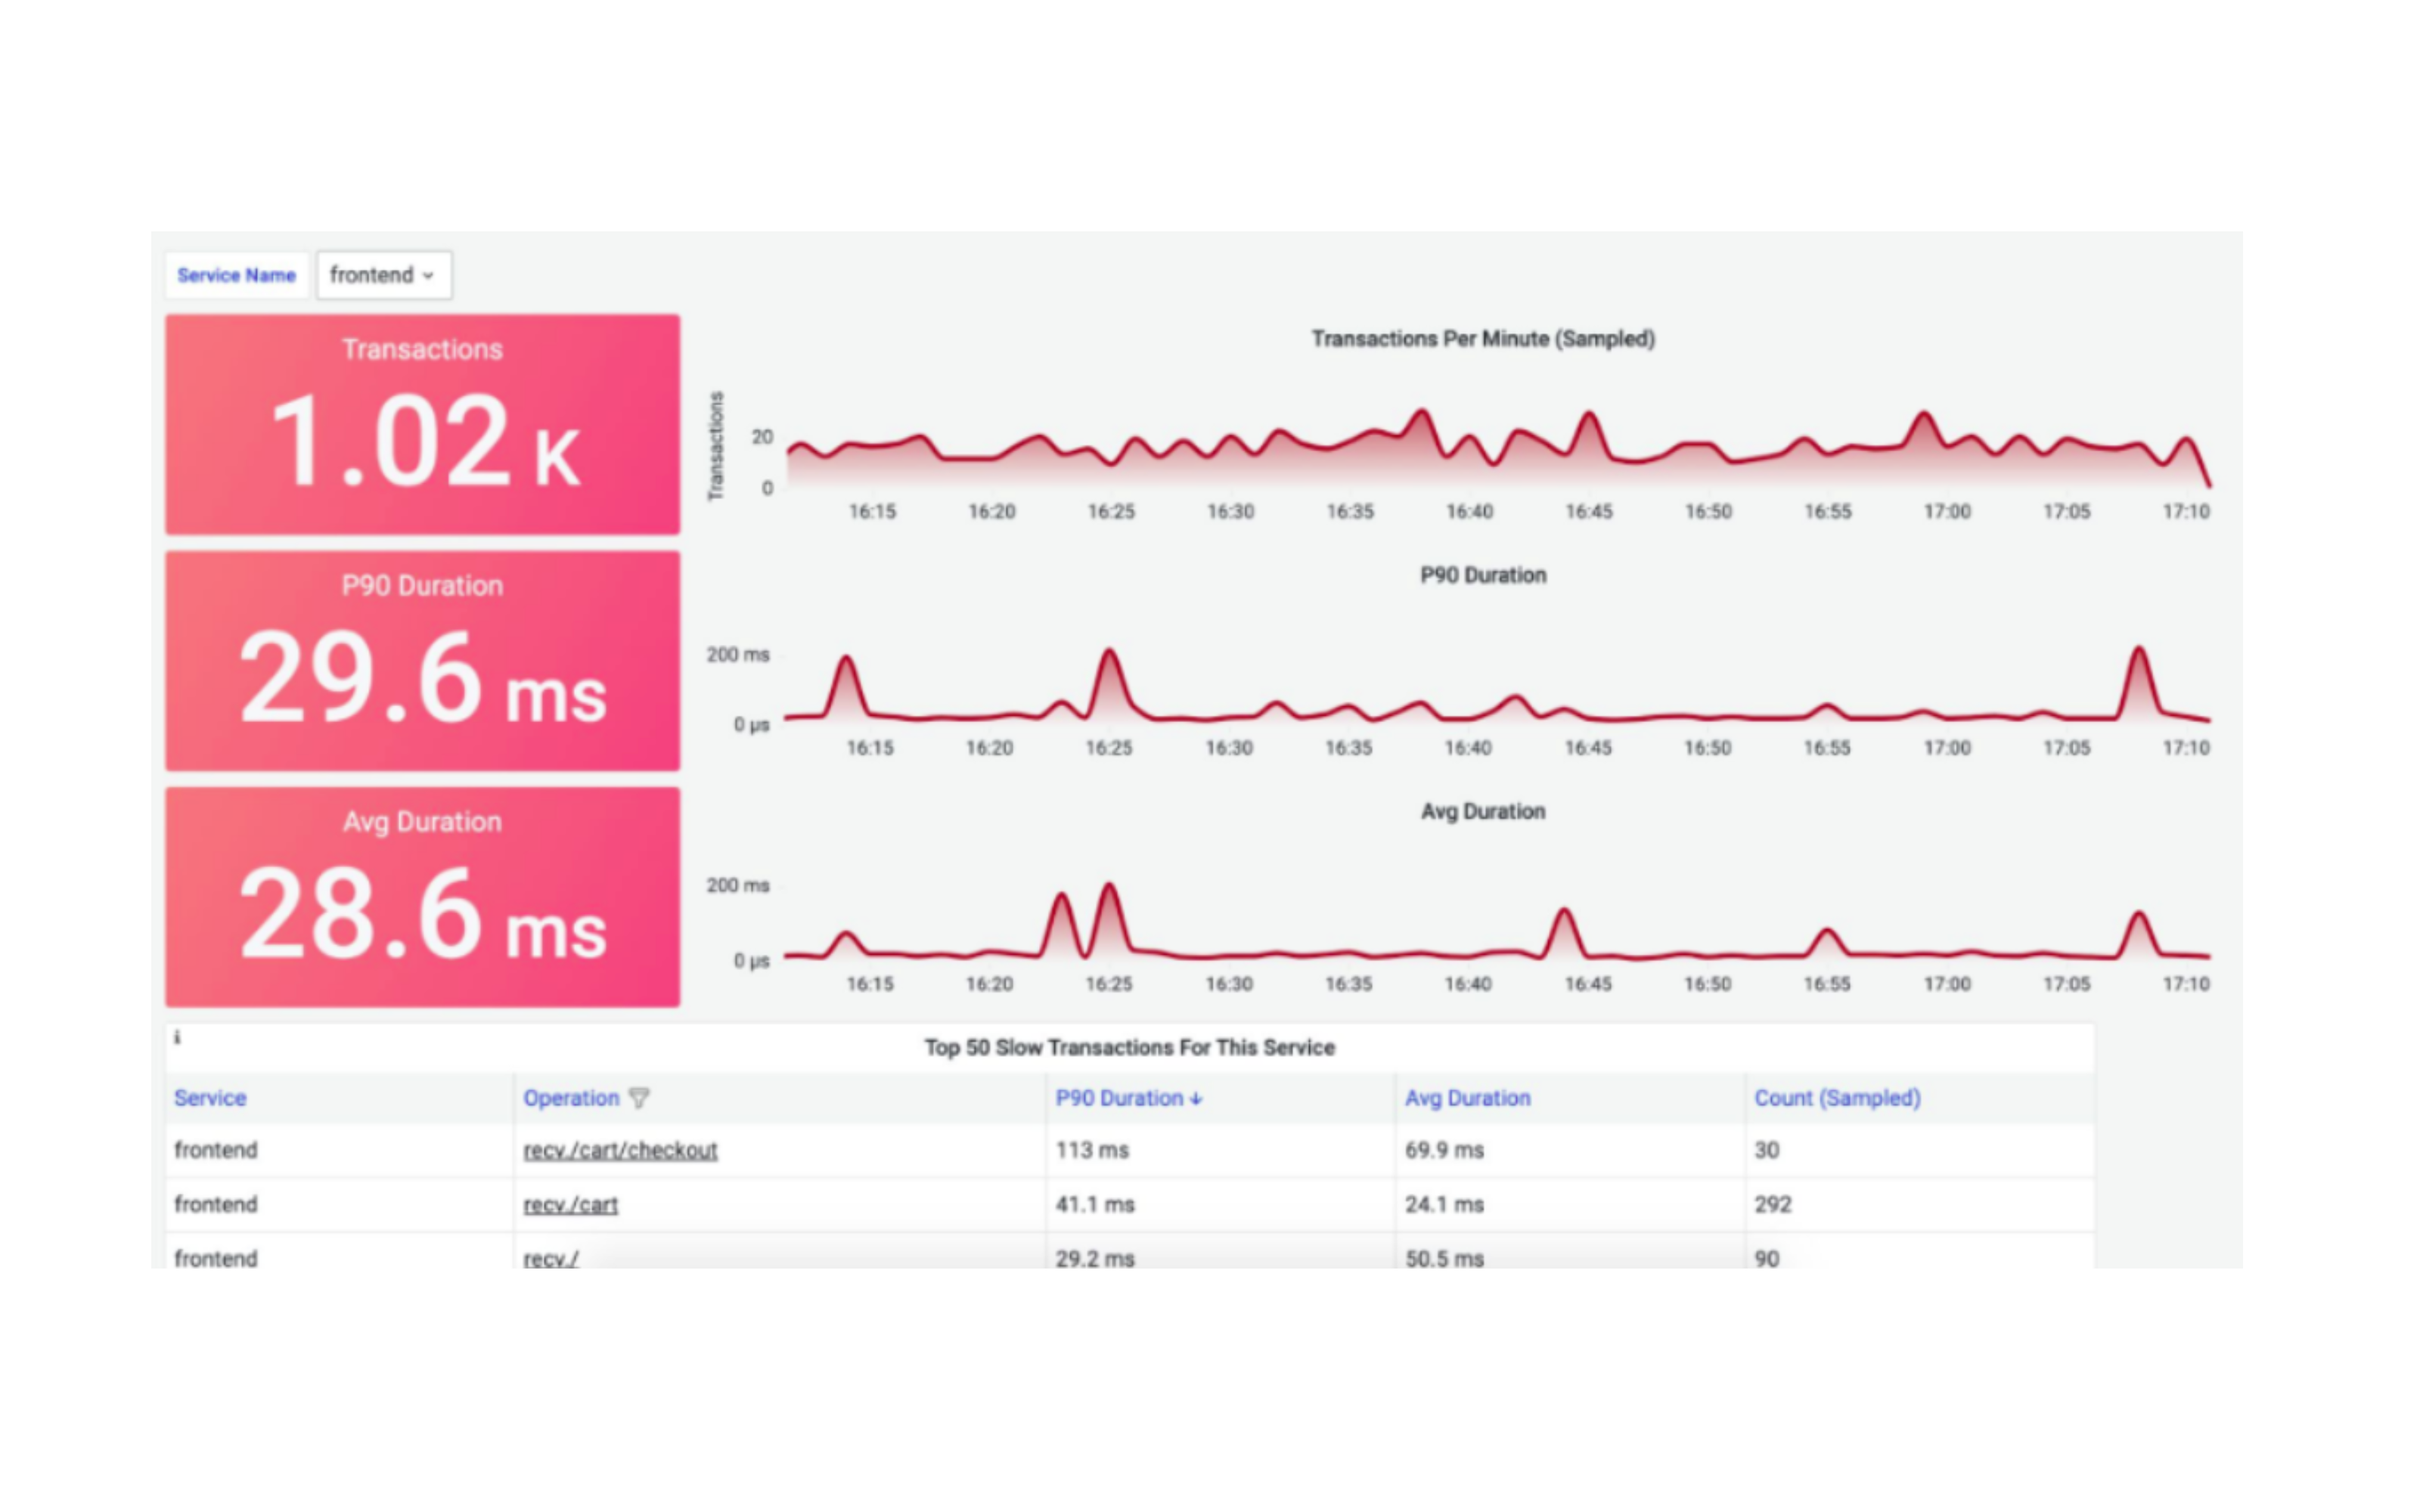
However, if you’re running Grafana yourself, which many do due to its relative ease-of-use, you may run into situations requiring some support as you scale.
This blog post is to help you out… with one very specific issue…
The Infamous “database is locked” Error
By default, when you bring up Grafana, it backends to a SQLite database (MySQL and PostgreSQL are also supported). Since SQLite is an embedded database laid out as a single file, it can be more susceptible to DB locks. The authoritative reference page on SQLite locking lays out the ways this may occur, along with corruption of the DB file itself. This includes scenarios like ungraceful restarts and updating rows of a table that have a SELECT on it.
Though lightweight Grafana usage may not ever hit this, certain situations that hit the tables hard (like pod restarts with sidecar containers or the Grafana alerting engine) can, on occasion, see this manifest. As a result, there are issues with Grafana functioning properly (like passing health checks, loading data sources, etc).
When you dig deeper into the root cause, you may see something like this (in this case, Grafana is running as a deployment in Kubernetes):
|
1 2 3 4 |
$ kubectl logs opsverse-user123-grafana-5678d56d6c-gmdk8 … t=2022-02-09T09:41:57+0000 lvl=error msg="failed to search for dashboards" logger=provisioning.dashboard type=file name=sidecarProvider error="database is locked" |
There are several GitHub issues detailing some of these, and the one open since 2019 suggests cloning the DB file, and then swapping out the new (cloned) DB file for the existing one (effectively releasing locks):
|
1 2 3 4 |
# At file path where database (“grafana.db”) is stored $ sqlite3 grafana.db '.clone grafana-new.db' $ mv grafana.db grafana-old.db $ mv grafana-new.db grafana.db |
The Helm chart provides an extraInitContainers key. We can utilize this to restart Grafana with the cloned DB replacing the locked one.
At that point, you can continue using SQLite with some of the suggested tweaks (see “Option 1” below), or you can migrate to Posgtres (see “Option 2”) below, as we do for our larger scale users.
Recover Locked Database File
We run mostly everything on Kubernetes. So, we can effectively use the Grafana Helm chart. If you’re using a different chart or deploying using a different mechanism, the same principles should apply.
So your values.yaml will have something like this:
|
1 2 3 4 5 6 7 8 9 10 11 12 13 |
extraInitContainers: - name: grafanadb-clone-and-replace image: keinos/sqlite3 command: - "/bin/sh" - "-c" - "/usr/bin/sqlite3 /var/lib/grafana/grafana.db '.clone /var/lib/grafana/grafana.db.clone'; mv /var/lib/grafana/grafana.db.clone /var/lib/grafana/grafana.db; chmod a+w /var/lib/grafana/grafana.db" imagePullPolicy: IfNotPresent securityContext: runAsUser: 0 volumeMounts: - name: storage mountPath: "/var/lib/grafana" |
Let’s explain what this does:
We need the sqlite3 client (to interact with the DB), so that image is pulled. When the container starts up (before the grafana-server itself, as this is an init container), it clones the locked grafana.db. It then replaces /var/lib/grafana/grafana.db with the newly cloned DB file.
After this, the Grafana container should start up with its new grafana.db.
Reminder: remove the extraInitContainers block so that future restarts of the pod don’t do needless clones and replace.
From here on out, you can continue using SQLite by trying out some tweaks or (as we recommend) migrate to PostgreSQL.
Option 1: Stick to SQLite
SQLite’s claim to fame is its near-zero configuration. This is highly attractive to developers and teams as there’s no operational overhead of managing a full blown database. Instead, as it’s packaged within Grafana itself, there’s a natural tendency to keep it.
The first thing you can try is to enable Write-Ahead Logging (WAL). As the locking guide linked above hinted, most of the locking issues can be attributed to older rollback-mode transactions:
|
1 2 3 4 5 |
grafana.ini: database: ... wal: true ... |
If some of the disadvantages of WAL aren’t your cup-of-tea (for example, if your grafana.db is on an NFS), then you can try to set the cache_mode to “shared” (it defaults to “private”):
|
1 2 3 4 5 |
grafana.ini: database: ... cache_mode: shared ... |
This should only be changed if enabling WAL is not possible for you. From their official documentation, SQLite claims it’s obsolete:
“Shared-cache mode was invented in 2006 at the request of developers of Symbian. Their problem was that if the contacts database on the phone was being synced, that would lock the database file. Then if a call came in, the database lock would prevent them from querying the contacts database in order to find the appropriate ring-tone for the incoming call, or a photo of the caller to show on screen, and so forth. WAL mode (circa 2010) is a better solution to this problem as it permits simultaneous access without breaking transaction isolation.”
Option 2: Migrate to PostgreSQL
If you’re consistently seeing the “database is locked” messages in Grafana’s log, our recommendation is to switch to PostgreSQL. This adds a bit of operational overhead, but may be offset by the stability it brings.
The steps to do this are:
-
- Bring up your own Postgres server
- On that instance, create a grafana database and user
- Update grafana.ini to point to the new Postgres DB
- Run the following (awesome!) migration tool within an init container to move contents of the existing SQLite grafana.db to the Postgres DB: https://github.com/wbh1/grafana-sqlite-to-postgres
- Remove the init container – Grafana should be up using Postgres as the config DB!
Here are some details on how to achieve this.
(1) Bring up your own Postgres
The Bitnami Helm chart is more than okay! You can also use AWS’ RDS, GCP’s Cloud SQL, or any other way you deploy / manage databases.
If using the Helm chart, you can even deploy this in the same namespace as your Grafana.
This can also be a part of a Dockerfile and you can then reference the image in your postgres Helm chart above:
|
1 2 3 |
postgres=# CREATE DATABASE grafana; postgres=# CREATE USER grafuser WITH PASSWORD 'grafpass'; postgres=# GRANT ALL PRIVILEGES ON DATABASE grafana TO grafuser; |
(3) Update grafana.ini to point to the new Postgres DB
After updating grafana.ini as below, re-deploy Grafana to start a fresh instance (we’ll migrate the SQLite data onto the instance in the next step)
|
1 2 3 4 5 6 7 8 9 |
grafana.ini: database: ... type: "postgres" host: "opsverse-user123-postgres:5432" name: "grafana" user: "grafuser" password: "grafpass" ... |
When Grafana is back up (default configs), carry-on with the next step to migrate the original grafana.db SQLite file to Postgres.
(4) Migrate data from grafana.db (SQLite) to Postgres
You can utilize the tool written here: https://github.com/wbh1/grafana-sqlite-to-postgres
You can run this manually because you already have access to (a) your original grafana.db file and (b) the connection information to your new Postgres DB.
Here, we show us running it as an init container (similar to how we did when we cloned the original SQLite grafana.db file to recover from the locked state earlier):
|
1 2 3 4 5 6 7 8 9 10 11 12 13 14 |
extraInitContainers: - name: migrator-sqlite-pg image: debian:stable-slim command: - "/bin/sh" - "-c" - "apt update; apt install -yf curl sqlite3; curl -kLs https://github.com/wbh1/grafana-sqlite-to-postgres/releases/download/ v2.1.0/grafana-migrate_linux_amd64-v2.1.0 -o grafana-migrate; chmod +x ./grafana-migrate; ./grafana-migrate /var/lib/grafana/grafana.db 'postgres://grafuser:grafpas@opsverse-user123-postgres:5432/grafana?sslmode=disable'; sleep 45" imagePullPolicy: IfNotPresent securityContext: runAsUser: 0 volumeMounts: - name: storage mountPath: "/var/lib/grafana" |
When the init container completes the migration (by downloading the migration tool and running it on the SQLite and Postgres DBs), the Grafana container will start up with the same configurations as what was in the original SQLite DB!
Remember to remove the init container (so that restarts don’t force a re-migration)!
Notes:
- Out of an abundance of caution, always pull your alerts and dashboards via APIs beforehand locally (in case you need to push them back to Grafana after). Some scripts that you can run: https://github.com/OpsVerseIO/installers/tree/main/misc/grafana-utils
- For Grafana v9, you can pull using the new API endpoints
|
1 2 3 4 |
## Pull from example-grafana # curl -H "" https://example-grafana/api/v1/provisioning/alert-rules/0pRSLU44k ## Push to local # curl -XPOST -H "Authorization: Bearer " -H "Content-type: application/json" https://localhost:3000/api/v1/provisioning/alert-rules -d @my-file.json |
- The steps in this blog are largely run against Grafana v8 instances.
- The migrator tool (looking at commit history) seems to be updated for Grafana v9 as well

